Exam 7: Graphs, Statistics, and Probability
Exam 1: Whole Numbers139 Questions
Exam 2: The Integers75 Questions
Exam 3: Fractions and Mixed Numbers94 Questions
Exam 4: Decimals119 Questions
Exam 5: Ratio, Proportion, and Measurement90 Questions
Exam 6: Percent70 Questions
Exam 7: Graphs, Statistics, and Probability44 Questions
Exam 8: An Introduction to Algebra60 Questions
Exam 9: An Introduction to Geometry100 Questions
Select questions type
How many more pet cats are there than pet dogs?
Is it possible to use bar graphs in this case?
(True/False)
4.9/5  (32)
(32)
Find the weighted mean of a set of values. Round to the nearest tenth. Value of x The weights to the x values 3 20 4 34 2 47 1 54
(Multiple Choice)
4.8/5 (36)
Refer to the line graph.
In approximately what year did miners begin to earn more than construction workers? 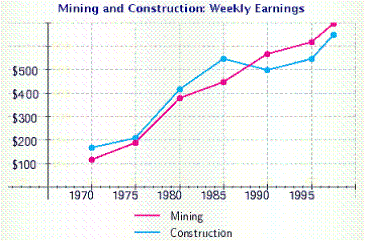
(Multiple Choice)
4.9/5 (28)
Which of the following illustrations best represents a bar graph?
(Multiple Choice)
4.8/5 (31)
Use the data in the table to make a line graph showing the average acreage (in acres) of U.S. farms for the years 1950 through 1990.
Year Number of U.S. farms (in millions) Average size of U.S. farms (acres) 1950 5.6 234 1960 4.0 330 1970 2.9 399 1980 2.4 441 1990 2.1 478 2000 2.2 439
(Multiple Choice)
5.0/5 (35)
Several groceries reported differing prices for a bread. The prices are as follows: 2.3, 2.6, 3.2, 2.8, 3.1, 3, 2.2, 2, 2.8. Find the mean, median, and mode of the prices for a bread. Then find the range of the prices.
(Multiple Choice)
4.8/5 (31)
Which of the following illustrations is a frequency polygon?
(Multiple Choice)
4.8/5 (39)
Use the following bar graph to find the average number of therms of natural gas used per month. 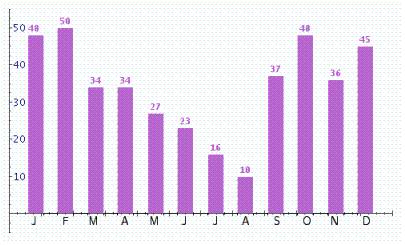
(Short Answer)
4.7/5 (37)
Several computer stores reported differing prices for a toner cartridge for a laser printer. The prices are as follows: 59, 50, 77, 70, 71, 73, 54, 56, 70. Find the mode of the prices for a toner cartridge.
(Multiple Choice)
4.8/5 (36)
Match the type of information with the most appropriate kinds of presentations.
Correct Answer: Verified
Premises:
Responses:
(Matching)
4.8/5 (34)
The class results on a mathematical quiz are shown in the table below. Find the average number of incorrect answers on the quiz.
Total number of incorrect answers on the quiz Number of students 0 4 1 4 2 8 3 10 4 1
(Multiple Choice)
4.8/5 (31)
Which of the following illustrations represents a circle graph?
(Multiple Choice)
4.8/5 (32)
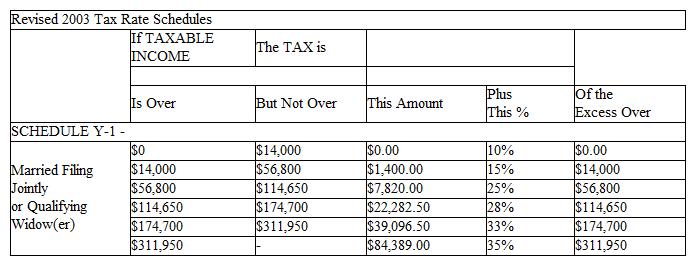
Raul has an adjusted income of $153,850, is married, and files jointly. Compute his tax.
(Multiple Choice)
4.9/5 (39)
If the symbol  = 1,800 cars, estimate what the symbol
  represents.
(Multiple Choice)
4.9/5 (34)
An ordinary die is rolled once. What is the probability of rolling an even number?
(Multiple Choice)
4.9/5 (24)
Find the mode (if any) of the list of data.
16, 16, 18, 18, 16, 17, 18, 16
(Multiple Choice)
4.9/5 (31)
Filters
- Essay(0)
- Multiple Choice(0)
- Short Answer(0)
- True False(0)
- Matching(0)