Exam 15: Basic Statistics
Exam 1: Basic Concepts447 Questions
Exam 2: Signed Numbers and Powers of 10200 Questions
Exam 3: The Metric System274 Questions
Exam 4: Measurement287 Questions
Exam 5: Polynomials: an Introduction to Algebra228 Questions
Exam 6: Equations and Formulas246 Questions
Exam 7: Ratio and Proportion116 Questions
Exam 8: Graphing Linear Equations113 Questions
Exam 9: Systems of Linear Equations114 Questions
Exam 10: Factoring Algebraic Expressions220 Questions
Exam 11: Quadratic Equations137 Questions
Exam 12: Geometry241 Questions
Exam 13: Right Triangle Trigonometry132 Questions
Exam 14: Trigonometry With Any Angle76 Questions
Exam 15: Basic Statistics201 Questions
Exam 16: Binary and Hexadecimal Numbers252 Questions
Select questions type
x is paired with y by the following table. -6 -3 -2 0 1 2 6 y -6 -6 -4 -4 -2 -2 0 Draw a scattergram for the data displayed.
(Multiple Choice)
4.8/5  (42)
(42)
x is paired with y by the following table. x 3 8 9 12 14 15 y 4 14 5 21 4 22 Draw a scattergram for the data displayed.
(Multiple Choice)
4.8/5 (40)
The highest level of education for persons age 25 and older in some state in 2004 can be found in the data below. Draw a circle graph. 8th grade or less 5.0\% Some high school 8.5\% High school graduate 32.3\% Some college 15.5\% Associate degree 7.5\% Bachelor's degree 18.4\% Master's degree 9.5\% Doctoral degree 1.0\% Professional degree 2.3\%
(Multiple Choice)
4.9/5 (37)
Four dice are rolled. What is the probability of getting 24?
(Multiple Choice)
4.9/5 (39)
An industrial technician must keep a chemical at a temperature below 60° F. He must also keep an hourly record of its temperature and record each day's temperature on a line graph. The following table shows the data he collected. Time 8:00 9:00 10:00 11:00 12:00 13:00 14:00 15:00 16:00 17:00 Temp. 59 58 53 52 50 56 51 50 58 56 Draw a line graph for these data.
(Multiple Choice)
4.9/5 (33)
Consider the following bar graph. How many barrels of oil per day were used by Japan? 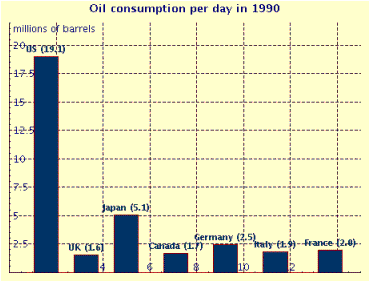 __________ million barrels
(Short Answer)
4.8/5 (40)
The sample space is the pieces of paper taken two at a time with the numbers 1-7 written on them. What is the probability that the sum of the two numbers drawn is 8?
(Multiple Choice)
4.8/5 (31)
The table below gives the average annual wage in some year for workers in the given industries. Draw a bar graph for these data.
(Multiple Choice)
4.9/5 (33)
Find the mean measurement for the set of measurements. 6.643 mm, 6.642 mm, 6.652 mm, 6.642 mm, 2.718282 mm
(Multiple Choice)
4.9/5 (29)
A pharmacist weighed ten different capsules of the same compound and recorded these measurements.
3,429 mg, 3,442 mg, 3,424 mg, 3,449 mg, 3,443 mg, 3,441 mg, 3,411 mg, 3,422 mg, 3,417 mg, 3,439 mg
What is the mean measurement?
(Multiple Choice)
4.9/5 (41)
Use the frequency distribution to find the mean and the sample standard deviation. Does the data form a normal distribution? Remember: if the data fall within 2% of the empirical rule of 68%, 95%, and 99.7% for one, two, or three standard deviations, respectively, they form a normal distribution. Shipment time (hours) Frequency f 23.5-28.5 19 28.5-33.5 417 33.5-38.5 789 38.5-43.5 698 43.5-48.5 504 48.5-53.5 42
(Multiple Choice)
4.8/5 (39)
The sample space is a bag with 2 red and 1 white marble with two marbles taken at a time. What is the probability that two red marbles will be drawn?
(Multiple Choice)
4.7/5 (37)
The following list gives 50 pieces of ranked data (ranked from smallest to largest). Find the 67th percentile.
Ranked data 15 50 81 122 148 16 53 87 123 148 20 55 94 126 152 27 55 98 130 154 31 60 99 131 159 31 63 102 133 161 36 68 105 138 166 40 72 110 141 168 42 75 118 143 172 48 80 118 146 177
(Multiple Choice)
4.9/5 (39)
Find the mean measurement for the set of measurements. 47.85 cm, 48.26 cm, 47.53 cm, 47.43 cm
(Multiple Choice)
4.8/5 (41)
Draw a circle graph. In 1999, U.S. nonfarm employment was as follows: manufacturing, 17.3 million
Other goods-producing industries, 5.1 million
Private service producing industries, 79.1 million
Government, 21 million
(Multiple Choice)
4.8/5 (32)
Find the median measurement for the set of measurements. , , , , , , , , , , ,
(Short Answer)
4.8/5 (37)
Find the mean measurement for the set of measurements. 1.001, 1.109, 1.055, 1.064, 1.116, 1.217
(Multiple Choice)
4.9/5 (39)
Filters
- Essay(0)
- Multiple Choice(0)
- Short Answer(0)
- True False(0)
- Matching(0)