Exam 9: Modeling Data
Exam 1: Building Blocks of Algebra379 Questions
Exam 2: Linear Equations and Inequalities With One Variable241 Questions
Exam 3: Linear Equations With Two Variables340 Questions
Exam 4: Systems of Linear Equations278 Questions
Exam 5: Exponents and Polynomials262 Questions
Exam 6: Factoring and Quadratic Equations288 Questions
Exam 7: Rational Expressions and Equations271 Questions
Exam 8: Radical Expressions and Equations237 Questions
Exam 9: Modeling Data74 Questions
Select questions type
During the years 1994 to 2007 seat belt use among front seat passengers ages 16 to 24 has increased. A linear model for the percentage of these passengers who use a seat belt is  where P is percentage with a seat belt and t is years since 2000. The years before 2000 have a negative value for t. If you use the model to predict the percentage of these passengers who used a seat belt in 2017 which are you doing?
(Multiple Choice)
4.9/5  (39)
(39)
The __________ for a linear data set is the equation of the line which is the best fit for the data.
(Short Answer)
4.7/5 (35)
During the years 2002 to 2008 smoking among twelfth grade students was declining. A linear model for the percentage of twelfth grade students who smoke is  . P is the percentage of twelfth graders who smoke and t is years since 2002. Find the slope of the model and explain the value of the slope in terms of the problem. Is percentage of twelfth graders who smoke going up or down over time?
(Essay)
4.9/5 (37)
Does the data graphed follow a linear pattern a parabolic pattern or neither? 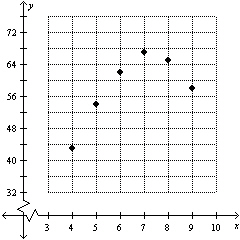
(Short Answer)
4.8/5 (34)
During the years 1994 to 2007 seat belt use among front seat passengers ages 16 to 24 has increased. A linear model for the percentage of these passengers who use a seat belt is 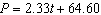 where P is percentage with a seat belt and t is years since 2000. The years before 2000 have a negative value for t. Use the model to predict the percentage of these passengers who used a seat belt in 1998.
(Multiple Choice)
4.8/5 (31)
During the years 2002 to 2008 smoking among twelfth grade students was declining. A linear model for the percentage of twelfth grade students who smoke is 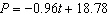 . P is the percentage of twelfth graders who smoke and t is years since 2002. Find the vertical intercept of the model and explain its value in terms of the problem.
(Essay)
4.9/5 (37)
The percentage of eighth grade students P participating in school music or performing arts in the years from 1996 to 2006 may be modeled by  where t is years since 1996. What is the slope in the model? What does it mean?
(Multiple Choice)
4.8/5 (40)
You have moved to Chicago in the fall. The graph shows the average monthly high temperature for months since you moved to Chicago. Does the graph show a linear pattern a quadratic pattern or neither? 
(Short Answer)
5.0/5 (36)
The graph shows the average monthly high temperature in Newark NJ for months from April to September. If a quadratic model  is fit to the graphed data set will a be positive or negative?
(Multiple Choice)
4.9/5 (41)
The percentage of eighth grade students P participating in school music or performing arts in the years from 1996 to 2006 may be modeled by 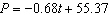 where t is years since 1996. Use the model to predict the percentage participation in 2020. Is this interpolation or extrapolation?
(Multiple Choice)
4.8/5 (44)
A quadratic model for the median price of a condo is given by 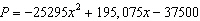 . The variable x is the years since 2000. Find the vertex of the model. Explain it in this problem.
(Multiple Choice)
4.9/5 (34)
The graph shows the average monthly high temperature in Newark NJ for months from November to April. If a quadratic model  is fit to the graphed data set will a be positive or negative?
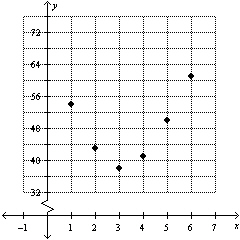
(Multiple Choice)
4.8/5 (41)
During the years 1994 to 2007 seat belt use among front seat passengers ages 16 to 24 has increased. A linear model for the percentage of these passengers who use a seat belt is  where P is percentage with a seat belt and t is years since 2000. The years before 2000 have a negative value for t. If you use the model to predict the percentage of these passengers who used a seat belt in 2006 which are you doing?
(Multiple Choice)
4.7/5 (42)
You have moved to Chicago in the fall. The graph shows the average monthly high temperature for months since you moved to Chicago. If a quadratic model  is fit to the graphed data set will a be positive or negative?
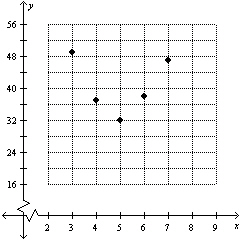
(Short Answer)
4.9/5 (38)
When you estimate an output value for an input value that is outside the data input values by using the model you are doing __________.
(Short Answer)
4.8/5 (43)
You are given a quadratic model  where t is time. If a is __________ the vertex identifies the minimum point.
(Short Answer)
4.7/5 (41)
The graph shows the average monthly high temperature in Newark NJ for months from April to September. If a quadratic model  is fit to the graphed data set estimate the coordinates of the vertex.
(Multiple Choice)
4.8/5 (38)
During the years 1994 to 2007 seat belt use among front seat passengers ages 16 to 24 has increased. A linear model for the percentage of these passengers who use a seat belt is  where P is percentage with a seat belt and t is years since 2000. The years before 2000 have a negative value for t. What is the slope of the model and what does it mean in terms of the problem?
(Multiple Choice)
4.8/5 (41)
A quadratic model for the median home price in Tampa Florida is given by  . The variable x is the years since 2000. Use the model to predict the median home price in the year 2008.
(Short Answer)
4.9/5 (44)
Filters
- Essay(0)
- Multiple Choice(0)
- Short Answer(0)
- True False(0)
- Matching(0)