Exam 14: Statistical Process Control
Exam 1: Introduction to Supply Chain and Operations Management67 Questions
Exam 2: Supply Chain and Operations Strategy80 Questions
Exam 3: Product and Process Design and Mapping89 Questions
Exam 4: Service Design96 Questions
Exam 5: Customer Relationship Management52 Questions
Exam 6: Strategic Sourcing78 Questions
Exam 7: Supplier Management59 Questions
Exam 8: Demand Management and Forecasting75 Questions
Exam 9: Inventory Management Fundamentals and Independent Demand84 Questions
Exam 10: Sales and Operations Planning and Enterprise Resource Planning110 Questions
Exam 11: Logistics94 Questions
Exam 12: Project Management90 Questions
Exam 13: Supply Chain Quality Management84 Questions
Exam 14: Statistical Process Control74 Questions
Exam 15: Lean and Six Sigma Management and Leading Change76 Questions
Select questions type
The control chart used to monitor the average of the characteristic being measured is called a(n)________ chart.
(Short Answer)
4.7/5  (33)
(33)
Aspects of the product that will result in either good or poor function of the product are known as ________.
(Short Answer)
4.9/5 (38)
On a control chart,________ successive data points on an increasing or decreasing line require an investigation for cause of progressive change.
(Short Answer)
4.7/5 (34)
Variation that results from a specific event,which may be a shift in a process mean or an unexpected occurrence,is known as random variation.
(True/False)
4.9/5 (36)
Variation that centers on a mean and occurs with a somewhat consistent amount of dispersion is known as random variation.
(True/False)
4.9/5 (33)
A manufacturer of snow shovels sees a drop in the demand for snow shovels due to an unseasonally warm winter.This means that the demand experiences
(Multiple Choice)
4.9/5 (40)
Adjusting a process when it only exhibits random variation is called ________.
(Short Answer)
4.8/5 (27)
A measurement to determine if a defect is either present or not is known as an attribute.
(True/False)
4.8/5 (30)
On a control chart,one data point out above the control limit is considered normal behavior.
(True/False)
4.8/5 (35)
On a control chart,two data points near the UCL requires an investigation for the cause of variation,however two data points near the LCL does not call for any investigation and is part of normal behavior.
(True/False)
4.8/5 (37)
Use the information below to answer the following question(s).
An inspector visually inspects 10 samples of 200 computer monitors each for defects. Using trained judgement,the inspector either accepts or rejects the monitors based on whether they are flawless. The table below gives the results of these inspections from the 10 samples:
Sample Defectives (out of Number 200 per sample) 1 5 2 4 3 6 4 3 5 4 6 4 7 6 8 5 9 2 10 5
-What is the UCL for a p chart?
(Multiple Choice)
4.8/5 (30)
Use the information below to answer the following question(s). Use the "Factors for Control Limits" Table A.3 from the textbook where required:
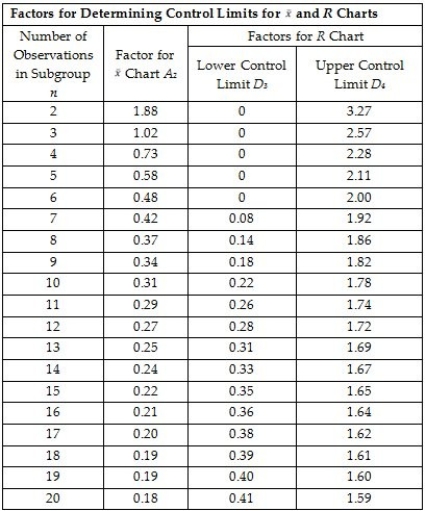 A control chart needs to be developed to determine if the temperature for a process is within control limits. Five samples each having 4 observations are taken and the sample measurements (temperature in degrees F)are noted in the table below:
Sample Observation 1 Observation 2 Observation 3 Observation 4 1 250 253.5 249 251.2 2 252 250.3 252 249.5 3 247.6 251 250 249.8 4 253.5 249 251 250.3 5 252 248.5 249.8 250.7
-What is the UCL for a R chart?
A control chart needs to be developed to determine if the temperature for a process is within control limits. Five samples each having 4 observations are taken and the sample measurements (temperature in degrees F)are noted in the table below:
Sample Observation 1 Observation 2 Observation 3 Observation 4 1 250 253.5 249 251.2 2 252 250.3 252 249.5 3 247.6 251 250 249.8 4 253.5 249 251 250.3 5 252 248.5 249.8 250.7
-What is the UCL for a R chart?
(Multiple Choice)
4.8/5 (34)
Filters
- Essay(0)
- Multiple Choice(0)
- Short Answer(0)
- True False(0)
- Matching(0)