Exam 16: Multivariate Analysis
Exam 1: Introduction23 Questions
Exam 2: The Nature of Science73 Questions
Exam 3: Research Ethics70 Questions
Exam 4: Elements of Research Design74 Questions
Exam 5: Measurement82 Questions
Exam 6: Sampling89 Questions
Exam 7: Experimentation75 Questions
Exam 8: Experimental Designs71 Questions
Exam 9: Survey Research76 Questions
Exam 10: Survey Instrumentation67 Questions
Exam 11: Field Research70 Questions
Exam 12: Research Using Available Data58 Questions
Exam 13: Multiple Methods65 Questions
Exam 15: Data Processing and Elementary Data Analysis72 Questions
Exam 16: Multivariate Analysis52 Questions
Exam 17: Writing Research Reports49 Questions
Select questions type
Multivariate regression is more likely than bivariate regression to produce a specification error.
(True/False)
4.8/5  (33)
(33)
Path analysis provides quantitative estimates of both direct and indirect effects.
(True/False)
4.7/5 (33)
A multivariate cross-tabulation with one control variable is called
(Multiple Choice)
4.9/5 (32)
Which of the following statements is not true of path analysis?
(Multiple Choice)
4.9/5 (43)
In nonexperimental research, as in experiments, it is possible to control statistically for variables that have not been measured.
(True/False)
4.9/5 (34)
R2 is a popular measure of how well a statistical model fits the data.
(True/False)
4.8/5 (39)
Table 1
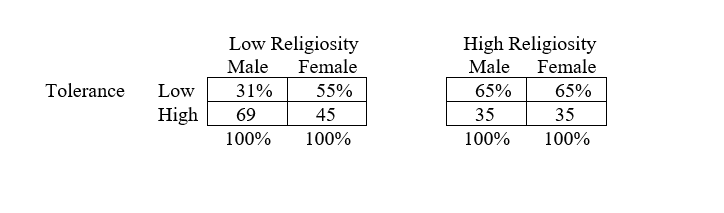 -Which statement best summarizes the outcome in Table 1?
(Multiple Choice)
4.8/5 (33)
The presence of a __________ variable makes a relationship __________.
(Multiple Choice)
4.8/5 (37)
A partial-regression coefficient in a multiple regression equation
(Multiple Choice)
4.9/5 (31)
Explain the difference between the regression coefficient in bivariate regression and the partial-regression coefficient in multiple regression.
(Essay)
4.9/5 (41)
The following tables show the relationship, for employed respondents, between hours per week the respondent usually works (Work hours), level of education (number of years completed), and sex for the 2016 GSS.
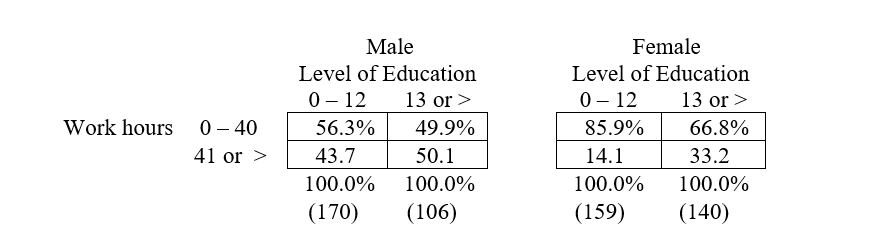 a. Which variable is controlled in each partial table?
b. Describe the relationship in each partial table.
c. The first partial (for males) has a chi-square value of 1.07, with p > .10; the second table (for females) has a chi-square value of 15.5, with p < .001. What do these statistics reveal about the relationships between the variables?
d. The zero-order association between level of education and usual hours worked per week was statistically significant. Comparing this result with the results of the partial tables, what type of elaboration outcome is shown?
a. Which variable is controlled in each partial table?
b. Describe the relationship in each partial table.
c. The first partial (for males) has a chi-square value of 1.07, with p > .10; the second table (for females) has a chi-square value of 15.5, with p < .001. What do these statistics reveal about the relationships between the variables?
d. The zero-order association between level of education and usual hours worked per week was statistically significant. Comparing this result with the results of the partial tables, what type of elaboration outcome is shown?
(Not Answered)
This question doesn't have any answer yet
Filters
- Essay(0)
- Multiple Choice(0)
- Short Answer(0)
- True False(0)
- Matching(0)