Exam 17: Change in Communities
Exam 1: The Web of Life68 Questions
Exam 2: The Physical Environment76 Questions
Exam 3: The Biosphere73 Questions
Exam 4: Coping With Environmental Variation:74 Questions
Exam 5: Coping With Environmental Variation: Energy71 Questions
Exam 6: Evolution and Ecology68 Questions
Exam 7: Life History69 Questions
Exam 8: Behavioral Ecology71 Questions
Exam 9: Population Distribution and Abundance80 Questions
Exam 10: Population Dynamics68 Questions
Exam 11: Population Growth and Regulation69 Questions
Exam 12: Predation70 Questions
Exam 13: Parasitism72 Questions
Exam 14: Competition74 Questions
Exam 15: Mutualism and Commensalism71 Questions
Exam 16: The Nature of Communities71 Questions
Exam 17: Change in Communities73 Questions
Exam 18: Biogeography70 Questions
Exam 19: Species Diversity in Communities72 Questions
Exam 20: Production73 Questions
Exam 21: Energy Flow and Food Webs76 Questions
Exam 22: Nutrient Supply and Cycling76 Questions
Exam 23: Conservation Biology73 Questions
Exam 24: Landscape Ecology and Ecosystem Management71 Questions
Exam 25: Global Ecology74 Questions
Select questions type
Which of the following is not an abiotic factor that can be an agent of change?
Free
(Multiple Choice)
4.9/5  (35)
(35)
Correct Answer: Verified
D
Refer to the figure.
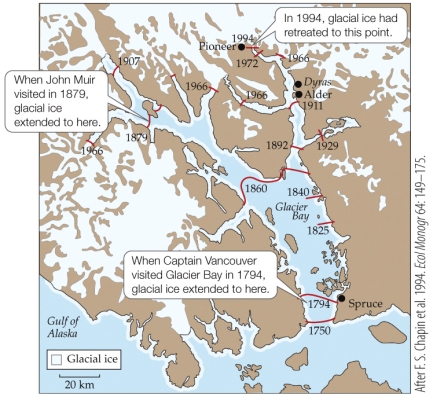 Chapin et al. conducted their work in Glacier Bay in 1994. If we were to return today to his plots, what could we predict to find in his former ten year-old pioneer communities that had been dominated by low shrubs, herbs, mosses, liverworts, and lichens?
Free
(Multiple Choice)
4.8/5 (32)
Correct Answer:Verified
C
Refer to the figure.
Figure 9
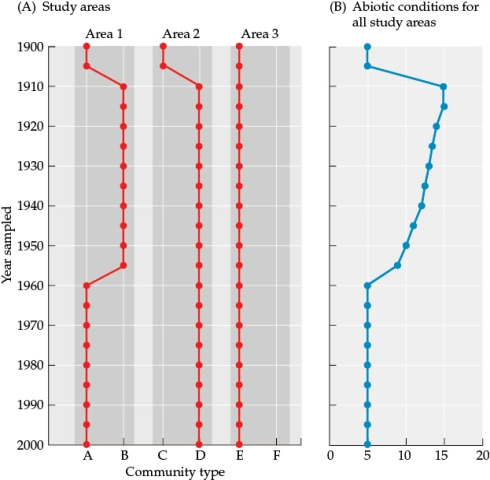 You are studying disturbance and succession patterns, focusing on data you collect in area 1, area 2, and area 3. Part A of the figure shows how the community type changed across each year sampled, and part B shows how the abiotic conditions changed across study years (no specific condition specified or units listed).
- Evaluate the successional paths for all three areas to answer the following questions:
a) What is hysteresis?
b) Which area shows evidence for this condition? Explain your answer.
You are studying disturbance and succession patterns, focusing on data you collect in area 1, area 2, and area 3. Part A of the figure shows how the community type changed across each year sampled, and part B shows how the abiotic conditions changed across study years (no specific condition specified or units listed).
- Evaluate the successional paths for all three areas to answer the following questions:
a) What is hysteresis?
b) Which area shows evidence for this condition? Explain your answer.
Free
(Essay)
4.8/5 (20)
Correct Answer:Verified
a) Hysteresis is the inability of a community to shift back to the original community type, even when the original conditions are restored.
b) Area 2 shows evidence for hysteresis. Following the disturbance, the community shifted from type D to type E and remained type E, even when abiotic conditions returned to those in which type D originally occurred.
Which human activity can bring about shifts in communities to alternative stable states?
(Multiple Choice)
4.8/5 (38)
Refer to the figure.
Figure 9
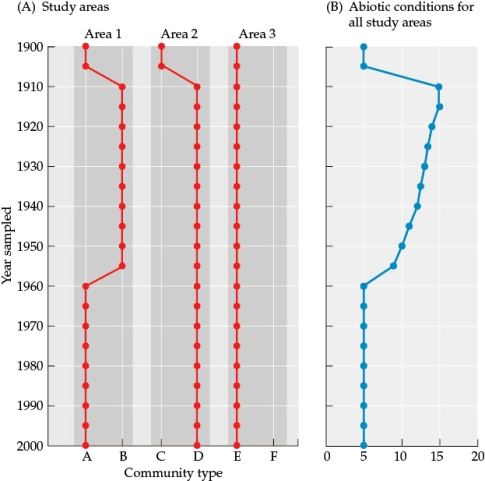 You are studying disturbance and succession patterns, focusing on data you collect in area 1, area 2, and area 3. Part A of the figure shows how the community type changed across each year sampled, and part B shows how the abiotic conditions changed across study years (no specific condition specified or units listed).
-Answer the following questions:
a) According to the data in in Figure 9, when did the disturbance occur?
b) Which years would provide baseline data for these communities? Why is baseline data important?
c) How many years did it take the abiotic conditions to return to levels similar to their original conditions?
d) How many years did it take for the biotic communities in areas 1, 2, and 3 to return to their original conditions?
You are studying disturbance and succession patterns, focusing on data you collect in area 1, area 2, and area 3. Part A of the figure shows how the community type changed across each year sampled, and part B shows how the abiotic conditions changed across study years (no specific condition specified or units listed).
-Answer the following questions:
a) According to the data in in Figure 9, when did the disturbance occur?
b) Which years would provide baseline data for these communities? Why is baseline data important?
c) How many years did it take the abiotic conditions to return to levels similar to their original conditions?
d) How many years did it take for the biotic communities in areas 1, 2, and 3 to return to their original conditions?
(Essay)
4.8/5 (41)
Refer to the figure.
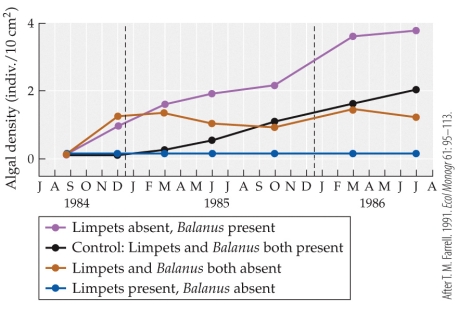 In Farrell's (1991) work on algal succession, the presence of limpets had what effect on the growth of algae?
(Multiple Choice)
4.7/5 (32)
Which statement about succession in the glaciers of Alaska is false?
(Multiple Choice)
4.8/5 (36)
The final theoretical stage of succession is called the _______ stage.
(Multiple Choice)
4.9/5 (35)
Refer to the figure.
Figure 10
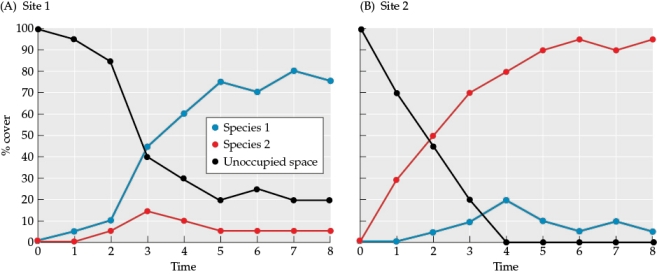
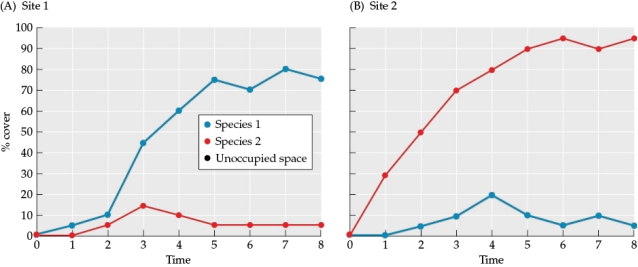 You are studying succession and colonization at two sites, site 1 and site 2. You sample the abundance of two species at the sites and determine their percent cover at each site and time period. Based on the data in Figure 10, does either site show evidence for facilitation? Why or why not?
(Essay)
4.8/5 (40)
In the dunes near Lake Michigan studied by Cowles, the dominant plant species in the early stages of succession was
(Multiple Choice)
4.9/5 (33)
Refer to the figure.
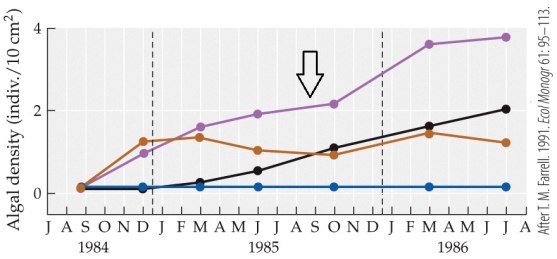 The figure is derived from studies of algal succession in the presence and absence of the barnacle Balanus and limpets. Which condition is represented by the purple line (indicated by the black arrow)?
(Multiple Choice)
4.7/5 (32)
Refer to the figures.
Figure 5
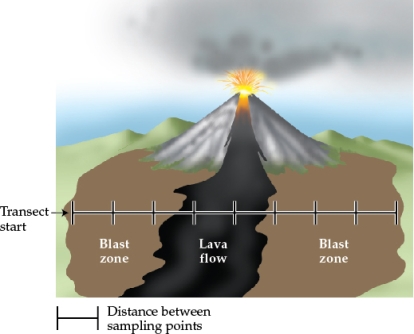 Figure 6
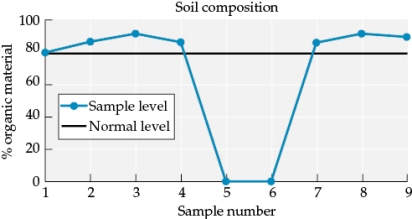 Figure 7
 You are studying the impacts of a volcanic eruption that produces a lava flow that covers part of a grassland (Figure 5). You begin taking samples as soon as the area is safe to work in-about one year after the main eruption has ended. You set up a transect (beginning at "Transect start" in Figure 5), and then collect data on how several abiotic and biotic factors vary across it (Figures 6 and 7).
-Answer the following questions:
a) According to the data in Figure 6, what was the effect of the eruption on the percent of organic material in the soil along the transect?
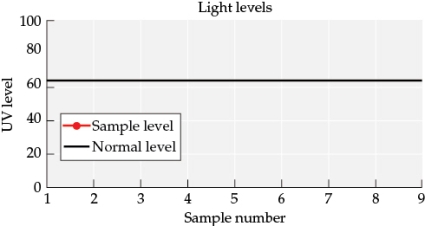
b) Based on Figure 5, predict how the eruption would have changed the amount of UV reaching ground level along the transect. Graph your prediction (this will be referred to as Figure 8).
c) Based on the available resources, what type of succession would you expect along the transect? In both the blast zone and lava flow areas, how extreme are the conditions faced by the colonizer species? How would you expect the extent of extreme conditions to limit the species that could potentially colonize the areas?
You are studying the impacts of a volcanic eruption that produces a lava flow that covers part of a grassland (Figure 5). You begin taking samples as soon as the area is safe to work in-about one year after the main eruption has ended. You set up a transect (beginning at "Transect start" in Figure 5), and then collect data on how several abiotic and biotic factors vary across it (Figures 6 and 7).
-Answer the following questions:
a) According to the data in Figure 6, what was the effect of the eruption on the percent of organic material in the soil along the transect?
b) Based on Figure 5, predict how the eruption would have changed the amount of UV reaching ground level along the transect. Graph your prediction (this will be referred to as Figure 8).
c) Based on the available resources, what type of succession would you expect along the transect? In both the blast zone and lava flow areas, how extreme are the conditions faced by the colonizer species? How would you expect the extent of extreme conditions to limit the species that could potentially colonize the areas?
(Essay)
4.7/5 (37)
Sutherland's experiments showed that the capacity of the tunicate Styela to dominate communities depends primarily on
(Multiple Choice)
4.7/5 (32)
Refer to the tables and the figure.
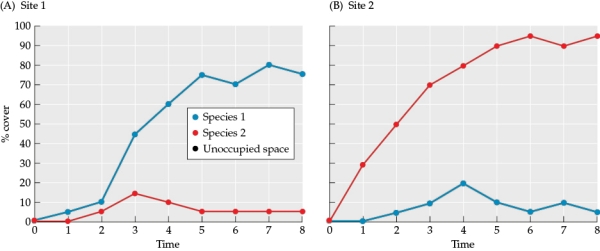
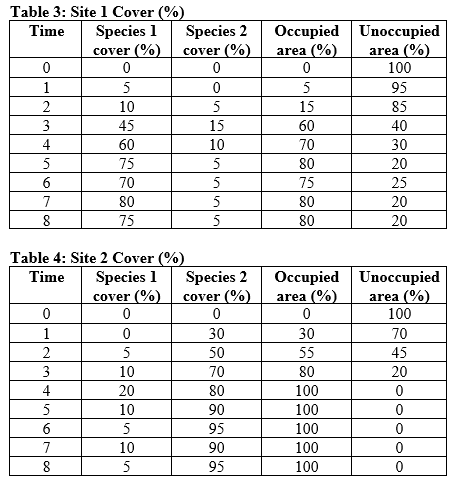 Figure 11
 You are studying succession and colonization at two sites, site 1 and site 2. You sample the abundance of two species at the sites and determine their percent cover at each site and time period.Answer the following questions:
a) When are the sites most vulnerable to colonization by an invasive species? Justify your answer.
b) By time 8, which site is least vulnerable to colonization by an invasive species? Why?
You are studying succession and colonization at two sites, site 1 and site 2. You sample the abundance of two species at the sites and determine their percent cover at each site and time period.Answer the following questions:
a) When are the sites most vulnerable to colonization by an invasive species? Justify your answer.
b) By time 8, which site is least vulnerable to colonization by an invasive species? Why?
(Essay)
4.9/5 (35)
Refer to the figure.
Figure 10
 You are studying succession and colonization at two sites, site 1 and site 2. You sample the abundance of two species at the sites and determine their percent cover at each site and time period. Use the data in Figure 10 and your knowledge of the different successional paths that communities can follow to answer the following questions:
a) Are the patterns of changes in abundance of species 1 and 2 consistent across the two sites?
b) Based on the consistency of abundances of species 1 and 2 across the sites, how would you describe the successional patterns observed at sites 1 and 2? What might be driving this pattern?
You are studying succession and colonization at two sites, site 1 and site 2. You sample the abundance of two species at the sites and determine their percent cover at each site and time period. Use the data in Figure 10 and your knowledge of the different successional paths that communities can follow to answer the following questions:
a) Are the patterns of changes in abundance of species 1 and 2 consistent across the two sites?
b) Based on the consistency of abundances of species 1 and 2 across the sites, how would you describe the successional patterns observed at sites 1 and 2? What might be driving this pattern?
(Essay)
4.8/5 (36)
Which statement about the amphibians that colonized the area around Mount St. Helens after the eruption is true?
(Multiple Choice)
4.8/5 (29)
Which manipulation(s) did Bertness and Shumway perform in their studies of succession in a New England salt marsh?
(Multiple Choice)
4.9/5 (32)
Which of the following would be considered a community stress?
(Multiple Choice)
4.8/5 (34)
Connell and Sousa criticized Sutherland's experiments on alternative stable states in fouling communities on the grounds that
(Multiple Choice)
4.7/5 (37)
Suppose that following a lava flow, pine grass (a hypothetical species) is the first species to colonize the area. Chemicals produced by pine grass change the soil chemistry in the environment, but these chemicals promote subsequent colonization by later species. Which model would best explain this scenario of succession?
(Multiple Choice)
4.8/5 (46)
Filters
- Essay(0)
- Multiple Choice(0)
- Short Answer(0)
- True False(0)
- Matching(0)