Exam 2: The Physical Environment
Exam 1: The Web of Life68 Questions
Exam 2: The Physical Environment76 Questions
Exam 3: The Biosphere73 Questions
Exam 4: Coping With Environmental Variation:74 Questions
Exam 5: Coping With Environmental Variation: Energy71 Questions
Exam 6: Evolution and Ecology68 Questions
Exam 7: Life History69 Questions
Exam 8: Behavioral Ecology71 Questions
Exam 9: Population Distribution and Abundance80 Questions
Exam 10: Population Dynamics68 Questions
Exam 11: Population Growth and Regulation69 Questions
Exam 12: Predation70 Questions
Exam 13: Parasitism72 Questions
Exam 14: Competition74 Questions
Exam 15: Mutualism and Commensalism71 Questions
Exam 16: The Nature of Communities71 Questions
Exam 17: Change in Communities73 Questions
Exam 18: Biogeography70 Questions
Exam 19: Species Diversity in Communities72 Questions
Exam 20: Production73 Questions
Exam 21: Energy Flow and Food Webs76 Questions
Exam 22: Nutrient Supply and Cycling76 Questions
Exam 23: Conservation Biology73 Questions
Exam 24: Landscape Ecology and Ecosystem Management71 Questions
Exam 25: Global Ecology74 Questions
Select questions type
Refer to the figures.
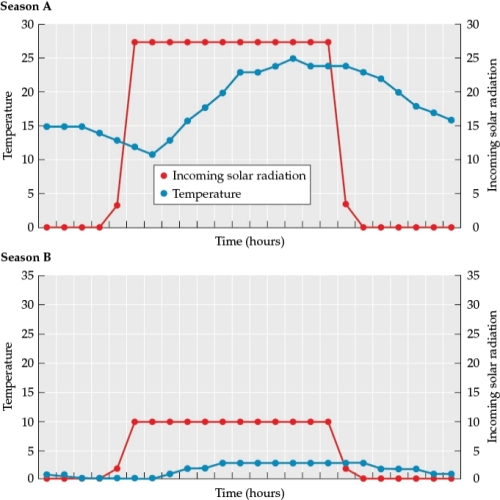
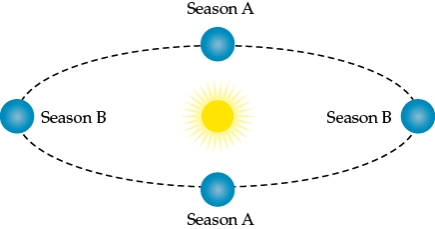
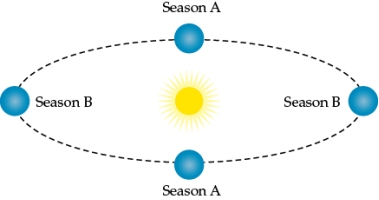 - You are one of a team of scientists studying a newly-discovered planet. You are receiving data from a probe that was landed on the planet by an unmanned mission. Your team is working with the little data you have from the probe to learn as much as you can about the planet's basic characteristics. The figure illustrates data collected by the probe at the same location on the planet during what you suspect are two different seasons (season A and season B). Based on your sketch of the planet at four different positions during its orbit around its sun (the second figure) and the data sent back by the probe, how many growing seasons would the planet have during one complete orbit of its sun?
Free
(Essay)
4.9/5  (42)
(42)
Correct Answer: Verified
It would experience two growing seasons during one complete orbit of its sun.
Vegetation patterns affect the reflectance of solar radiation. The capacity of a land surface to reflect solar radiation is known as its
Free
(Multiple Choice)
4.8/5 (36)
Correct Answer:Verified
A
Refer to the figure.
 -You are one of a team of scientists studying a newly-discovered planet. You are receiving data from a probe that was landed on the planet by an unmanned mission. Your team is working with the little data you have from the probe to learn as much as you can about the planet's basic characteristics. The figure illustrates data collected by the probe at the same location on the planet during what you suspect are two different seasons (season A and season B). Based on what you have inferred from the data in the figure, sketch a new figure of the hypothetical orbit of this planet around its sun. Sketch the planet at four different positions during its orbit around its sun (at 12:00, 3:00, 6:00, and 9:00, relative to the sun). Label the seasons (A or B) at each of these four locations.
Free
(Essay)
4.7/5 (36)
Correct Answer:Verified
During _______, Earth is closest to the sun. This occurs during the month of _______.
(Multiple Choice)
4.9/5 (30)
Refer to the figure.
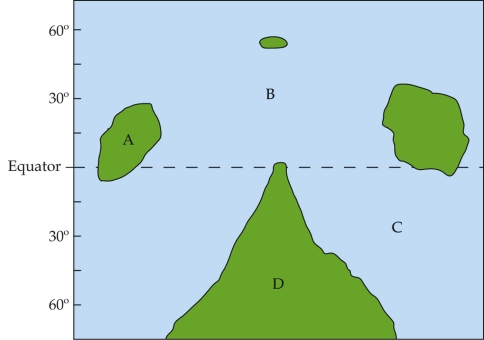 The map is of an imaginary planet that is roughly the same as Earth. Like Earth, it is tilted on its axis by about 23 , and it rotates around a sun-like star in approximately one year. At which site would a high-pressure system be most likely to develop during the summer?
(Multiple Choice)
4.9/5 (35)
Refer to the map.
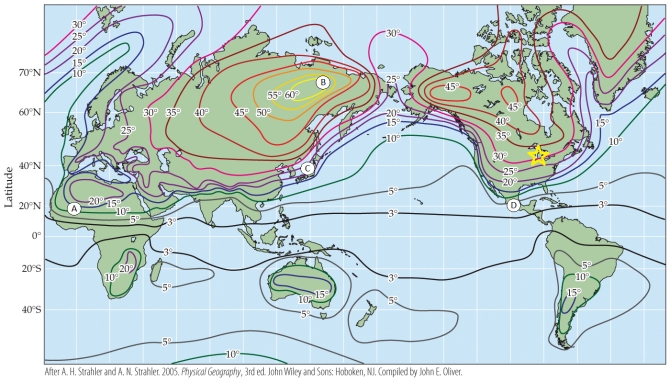 The map shows annual seasonal temperature variation (in °C). Which region shows the greatest temperature variation?
(Multiple Choice)
4.8/5 (35)
The Coriolis effect causes moving air at Earth's surface to appear to be deflected _______ in the Northern Hemisphere and _______ in the Southern Hemisphere.
(Multiple Choice)
4.9/5 (34)
High productivity in the open ocean would most likely be found in
(Multiple Choice)
4.9/5 (39)
In equatorial regions, the sun's rays strike Earth's surface at a more _______ angle than they do toward the poles. This means that the same amount of energy is spread over a(n) _______ area in equatorial regions than in polar regions.
(Multiple Choice)
4.8/5 (37)
Refer to the figure.
 - You are one of a team of scientists studying a newly-discovered planet. You are receiving data from a probe that was landed on the planet by an unmanned mission. Your team is working with the little data you have from the probe to learn as much as you can about the planet's basic characteristics. The figure illustrates data collected by the probe at the same location on the planet during what you suspect are two different seasons (season A and season B). The average daily temperature of the probe during season A is about 19°C while the average temperature of the same location in season B is 2°C. Imagine instead that the averages recorded were 40°C in season A and -20°C in season B. List three characteristics of the planet that, if they were different, could cause these more extreme seasonal differences. Justify your answers.
(Essay)
4.7/5 (31)
Refer to the figure.
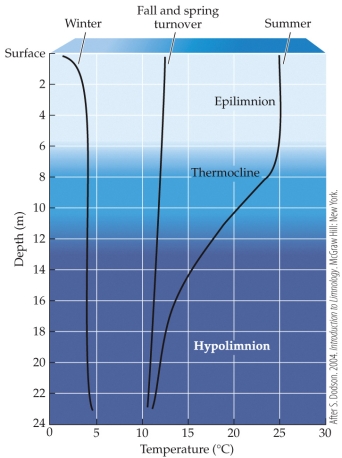 The figure shows the temperature of water at different depths in a typical temperate-zone lake. Which of the following statements is true?
(Multiple Choice)
4.7/5 (32)
Refer to the figure.
 -You are one of a team of scientists studying a newly-discovered planet. You are receiving data from a probe that was landed on the planet by an unmanned mission. Your team is working with the little data you have from the probe to learn as much as you can about the planet's basic characteristics. The figure illustrates data collected by the probe at the same location on the planet during what you suspect are two different seasons (season A and season B). Do you think the planet is tilted on its axis? Describe how the data supports your hypothesis.
(Essay)
4.7/5 (37)
The Connecticut River valley in western New England is an area of lowlands in between hills on both its west and east sides. During the fall and winter, the river valley will most likely be cooler than the surrounding hill towns
(Multiple Choice)
4.8/5 (44)
Compared with land at the same latitude, ocean waters tend to be _______ in the winter and _______ in the summer because water has a _______ heat capacity than land has.
(Multiple Choice)
4.8/5 (38)
Snow is white, and thus has a _______ albedo than bare ground. If global warming decreases snow cover, the resulting change in albedo is likely to _______ further warming.
(Multiple Choice)
4.9/5 (39)
When Earth's orbit becomes more circular (i.e., compared with a more elliptical orbit), the distance between Earth and the sun at aphelion _______. This change leads to a(n) _______ in the intensity of solar radiation at aphelion, and thus _______ seasonality.
(Multiple Choice)
4.8/5 (36)
Re-foresting tropical areas that have been deforested would result in a(n) _______ in the area's albedo and a(n) _______ in the area's evapotranspiration rates that should cause the area to recover from the slightly _______ regional climate that is a result of tropical deforestation.
(Multiple Choice)
4.9/5 (38)
The pH of a sample of water that had 10 times the concentration of H+ ions as a sample with a pH of 5.8 would be
(Multiple Choice)
4.9/5 (35)
Filters
- Essay(0)
- Multiple Choice(0)
- Short Answer(0)
- True False(0)
- Matching(0)