Exam 1: The Web of Life
Exam 1: The Web of Life68 Questions
Exam 2: The Physical Environment76 Questions
Exam 3: The Biosphere73 Questions
Exam 4: Coping With Environmental Variation:74 Questions
Exam 5: Coping With Environmental Variation: Energy71 Questions
Exam 6: Evolution and Ecology68 Questions
Exam 7: Life History69 Questions
Exam 8: Behavioral Ecology71 Questions
Exam 9: Population Distribution and Abundance80 Questions
Exam 10: Population Dynamics68 Questions
Exam 11: Population Growth and Regulation69 Questions
Exam 12: Predation70 Questions
Exam 13: Parasitism72 Questions
Exam 14: Competition74 Questions
Exam 15: Mutualism and Commensalism71 Questions
Exam 16: The Nature of Communities71 Questions
Exam 17: Change in Communities73 Questions
Exam 18: Biogeography70 Questions
Exam 19: Species Diversity in Communities72 Questions
Exam 20: Production73 Questions
Exam 21: Energy Flow and Food Webs76 Questions
Exam 22: Nutrient Supply and Cycling76 Questions
Exam 23: Conservation Biology73 Questions
Exam 24: Landscape Ecology and Ecosystem Management71 Questions
Exam 25: Global Ecology74 Questions
Select questions type
What is one reason that amphibians are especially good biological indicators of environmental conditions?
Free
(Multiple Choice)
4.9/5  (31)
(31)
Correct Answer: Verified
A
What evidence led Ruth and Sessions to conclude that parasites could be the cause of some of the deformities in the frogs found in the ponds of Northern California?
Free
(Multiple Choice)
4.7/5 (39)
Correct Answer:Verified
C
Which statement about the concept of natural selection is false?
Free
(Multiple Choice)
4.9/5 (29)
Correct Answer:Verified
C
A scientist monitors both the pollution entering a city's water supply and the changing populations of fish and other organisms thought to be affected by this pollution. He also speaks regularly at city council meetings, giving the results of his studies, and suggests changes in local laws that could help control the pollution. Based on his activities, this person could best be described as
(Multiple Choice)
4.8/5 (33)
Refer to the figure.
 Vredenburg studied the impact of the introduction of rainbow and brook trout on a species of amphibian, the mountain yellow-legged frog (Rana muscosa). After showing greatly decreased frog populations in lakes with trout, he set up an experiment using three categories of lakes: lakes from which he removed trout, lakes that had never had trout, and lakes that still contained trout. He compared the number of adult frogs per 10 m of shoreline in all groups, as shown in the figure. What is the most likely reason that Vredenburg chose to use a large-scale experimental design such as this, rather than a single lake or laboratory experiments?
(Multiple Choice)
4.9/5 (34)
Refer to the figure.
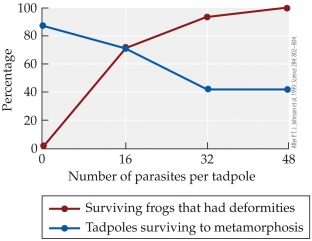 The figure is based on Johnson's experiment on the effects of trematode parasites on tadpoles. According to the figure, how did adding 16 parasites per tadpole to a group of tadpoles affect their survival?
(Multiple Choice)
4.8/5 (33)
Refer to the figure.
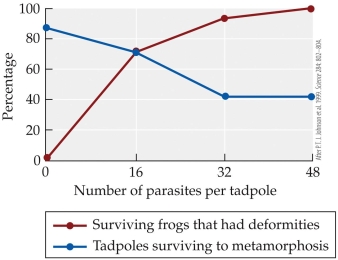 -The figure is based on Johnson's experiment on the effects of trematode parasites on tadpoles. Which statement best describes the control group in the experiment?
(Multiple Choice)
4.8/5 (38)
Refer to the figure.
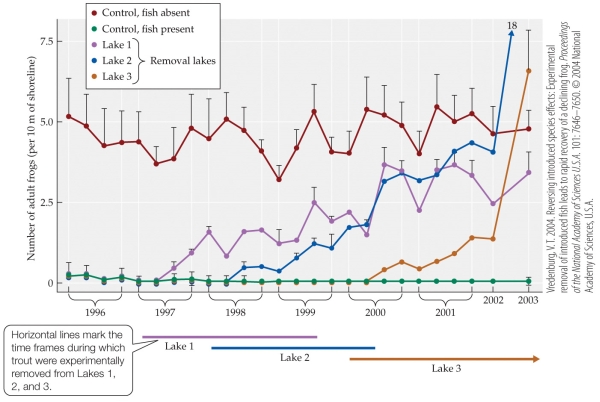 Vredenburg studied the impact of introduction of rainbow and brook trout on a species of amphibian, the mountain yellow-legged frog (Rana muscosa). After showing greatly decreased frog populations in lakes with trout, he set up an experiment using three categories of lakes: lakes from which he removed trout, lakes that had never had trout, and lakes that still contained trout. He compared the number of adult frogs per 10 m of shoreline in all groups, as shown in the figure. In Vredenburg's experimental design, why did he use two control groups?
(Multiple Choice)
4.8/5 (37)
The most appropriate spatial scale for a study of world climatic processes would likely be
(Multiple Choice)
4.7/5 (39)
Refer to the figure.
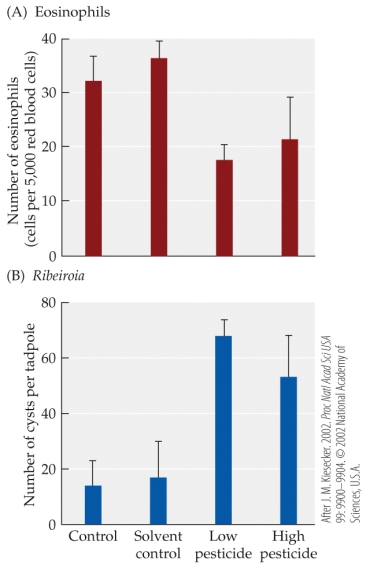 - The figure is based on studies of the effects of pesticides on the tadpole immune system. In a laboratory experiment, wood frog (Rana sylvatica) tadpoles were exposed to low or high concentrations of a pesticide, and then Ribeiroia parasites. The tadpoles were then examined for (A) numbers of eosinophils and (B) numbers of Ribeiroia cysts. Error bars show one SE of the mean. Compared with the control group, the frogs exposed to low concentrations of pesticides showed an increase _______ percent in the number of eosinophils.
(Multiple Choice)
4.9/5 (29)
In 1878, seal hunters introduced rabbits to Macquarie Island, between Australia and Antarctica. The rabbit population soared and the Myxoma virus was then introduced to kill off rabbits. It worked, but the islands' cats, which had depended on the rabbits for food, began eating seabirds instead. To save the seabirds, scientists started a program to kill off the cats. Twenty-four years later, in 2009, the rabbit population had exploded again, and rabbits were ravaging native plant species and devastating the island's ecosystem. This story appears to be an example of
(Multiple Choice)
4.7/5 (22)
Many species live in the Quabbin Reservoir in Massachusetts, and these different species interact to varying degrees. This is an example of a(n)
(Multiple Choice)
4.9/5 (41)
Refer to the figure.
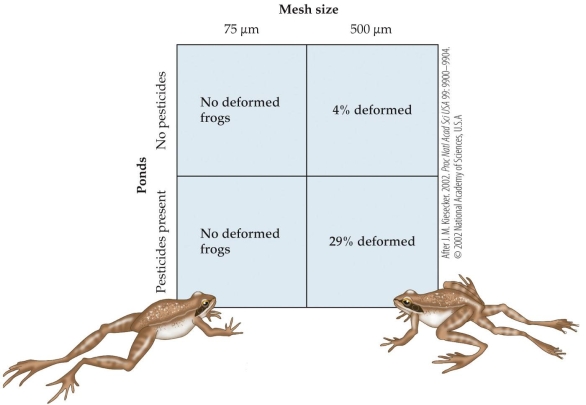 -The figure is based on Kiesecker's field experiments testing the effects of parasites and pesticides on frogs. Which statement is the most valid interpretation of the results?
(Multiple Choice)
4.9/5 (43)
Which statement about the relationship between consumers and producers is true?
(Multiple Choice)
4.8/5 (40)
Refer to the figure.
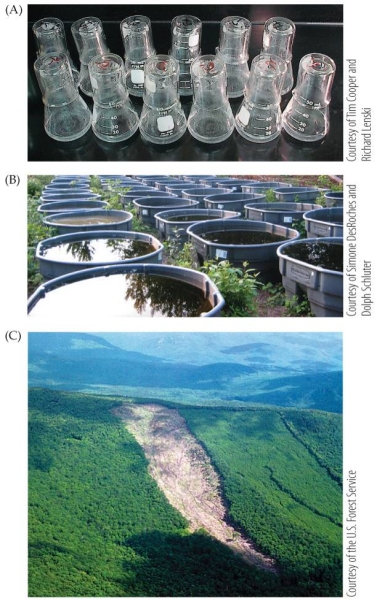 The figure shows three types of experimental setups: laboratory, small-scale field study, and large-scale field study. In which of the following cases would the large-scale field study be the most appropriate?
(Multiple Choice)
4.9/5 (32)
Would you use an observational, experimental, or modeling approach to study a rare, endangered bird species? Why would the approach you chose be a better choice than the others for your study?
(Essay)
4.9/5 (37)
A team of researchers investigated the effects of fertilizer on the growth of forest trees. They used an old Christmas tree plantation with pine trees of the same species and age, dividing it into plots and testing growth rates at different levels of fertilization. They calculate averages from their treatment groups, and see that the low-fertilizer group had a higher growth rate than the high-fertilizer group. They conclude that applying a small amount of fertilizer always causes all trees to grow faster than applying a large amount. Is this conclusion valid? Explain.
(Essay)
4.8/5 (31)
It is difficult to study the process of evolution in most species of organisms because
(Multiple Choice)
4.9/5 (31)
Which of the following is an abiotic feature of the environment?
(Multiple Choice)
4.8/5 (34)
Filters
- Essay(0)
- Multiple Choice(0)
- Short Answer(0)
- True False(0)
- Matching(0)