Exam 7: Mendelian Genetics in Populations II: Migration, Drift, & Nonrandom Mating
Exam 1: A Case for Evolutionary Thinking: Understanding HIV30 Questions
Exam 2: The Pattern of Evolution30 Questions
Exam 3: Evolution by Natural Selection30 Questions
Exam 4: Estimating Evolutionary Trees30 Questions
Exam 5: Variation Among Individuals30 Questions
Exam 6: Mendelian Genetics in Populations I: Selection and Mutation30 Questions
Exam 7: Mendelian Genetics in Populations II: Migration, Drift, & Nonrandom Mating30 Questions
Exam 8: Evolution at Multiple Loci: Linkage and Sex30 Questions
Exam 9: Evolution at Multiple Loci: Quantitative Genetics30 Questions
Exam 10: Studying Adaptation: Evolutionary Analysis of Form and Function30 Questions
Exam 11: Sexual Selection30 Questions
Exam 12: The Evolution of Social Behavior30 Questions
Exam 13: Aging and Other Life-History Characters30 Questions
Exam 14: Evolution and Human Health30 Questions
Exam 15: Phylogenomics and the Molecular Basis of Adaptation30 Questions
Exam 16: Mechanisms of Speciation28 Questions
Exam 17: The Origins of Life and Precambrian Evolution31 Questions
Exam 18: Evolution and the Fossil Record30 Questions
Exam 19: Development and Evolution30 Questions
Exam 20: Human Evolution30 Questions
Select questions type
The assumptions of the Hardy-Weinberg equilibrium principle include all of the following except ________.
Free
(Multiple Choice)
4.9/5  (39)
(39)
Correct Answer: Verified
C
The fact that blind luck (more technically known as sampling error)can account for changes in allelic frequencies in populations is the evolutionary mechanism called ________.[two words]
Free
(Short Answer)
4.8/5 (32)
Correct Answer:Verified
genetic drift
Suppose a founding population carries an allelic frequency not typical of the original population.Which of the following effects would most likely lead to homogenization?
Free
(Multiple Choice)
4.8/5 (33)
Correct Answer:Verified
D
At present,the neutral theory of molecular evolution ________.
(Multiple Choice)
4.8/5 (32)
The results of an experiment on genetic drift on Drosophila melanogaster are illustrated in the accompanying figure.These data show ________. 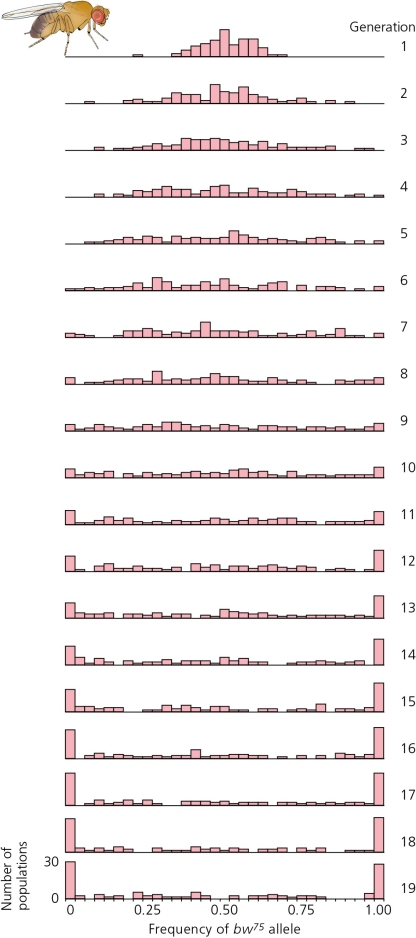
(Multiple Choice)
4.7/5 (36)
When we track alleles from lineages backwards in time,we see them ultimately fuse into one lineage.The result is a gene tree,which is produced by a process called ________.
(Short Answer)
4.8/5 (36)
A phenomenon known as ________ [one or two words] occurs under conditions where a strong selection pressure acts on a particular change in an amino acid,which results in the corresponding increase in frequency of a closely linked neutral (or even mildly deleterious)mutation.
(Short Answer)
4.8/5 (32)
The accompanying figure details the possible outcomes in a scenario in which 10 zygotes are formed from a gene pool where the frequency of the allele A1 is 0.6,and A2 is 0.4.This graph is shown here.According to this graph,the probability that the frequency of A1 will increase to 0.7 in the next generation is about ________. 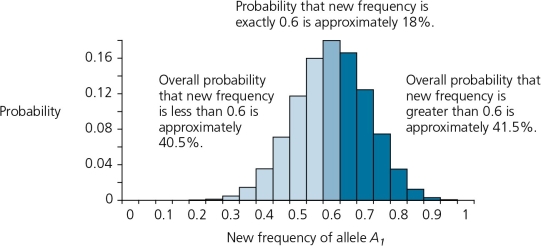
(Multiple Choice)
4.9/5 (44)
Data in the accompanying figure shows the results of allelic frequency analysis of an insect-pollinated plant whose seeds are transported by wind and water,therefore making this plant one of the first colonizers of new islands.The data―particularly the lower variation of allele frequencies of intermediate-aged populations―supports the hypothesis that ________.
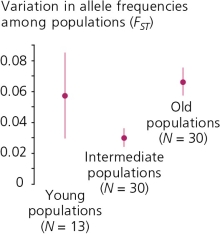
(Multiple Choice)
4.8/5 (39)
A locus at which different individuals in a population carry different alleles is known as a(n)________.
(Short Answer)
4.9/5 (36)
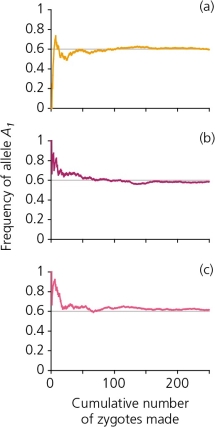
A scenario in which 250 zygotes are formed from a gene pool in which the frequency of the allele A₁ is 0.6,and A₂ is 0.4,generates the accompanying figure.Explain,in general terms,what each of these graphs reveals.Is there a consistent pattern between all three graphs? If so,describe and provide an explanation for it.Are there inconsistencies among graphs? Describe and provide an explanation for these also.
(Not Answered)
This question doesn't have any answer yet
The effects of inbreeding depression has been documented in ________.
(Multiple Choice)
4.8/5 (36)
In an evolutionary sense,________ is the transfer of alleles from one population to another.
(Short Answer)
4.8/5 (30)
With enough time and in the absence of other evolutionary mechanisms,genetic drift will ________.
(Multiple Choice)
4.8/5 (33)
The random discrepancy between theoretical predictions and actual outcomes is called ________.[two words]
(Short Answer)
4.8/5 (34)
The survival and fertility rates of the offspring of related individuals are commonly reduced.This is known as ________.[two words]
(Short Answer)
4.9/5 (32)
Unusually high rates of rare heritable traits,such as achromatopsia in the Pingelapese people,is often due to ________.
(Multiple Choice)
4.9/5 (27)
The neutral theory of molecular evolution,as developed by Kimura,posits that ________.
(Multiple Choice)
4.7/5 (37)
If genetic drift is not accompanied by natural selection,mutation,or migration,then the frequencies of alleles will "wander" between 0 and 1.Using the accompanying figure,which of the following is an accurate statement? 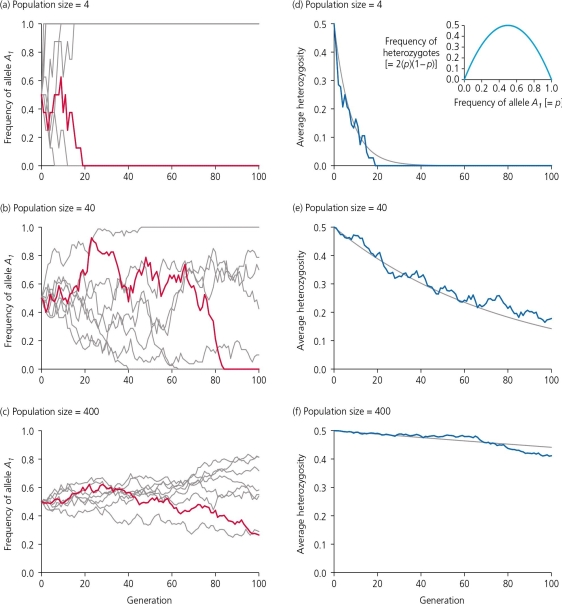
(Multiple Choice)
4.9/5 (31)
Filters
- Essay(0)
- Multiple Choice(0)
- Short Answer(0)
- True False(0)
- Matching(0)