Exam 14: One Factor Fixed-Effects Ancova With Single Covariate
The covariate in ANCOVA is also referred to as which one of the following?
B
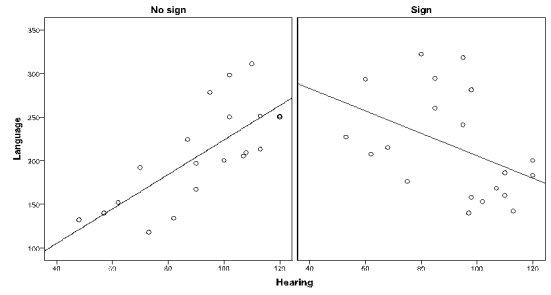
Dr. Green conducted an ANCOVA to determine whether hearing-impaired children who were taught sign language early on would develop better language skills compared to those who did not learn sign language. The data set contains two independent random samples (children who learned sign language and those who did not) of paired values on the covariate (X; child's hearing) and the dependent variable (Y; language skills measured when the child was three years old). Dr. Green also examined the data to see if the assumptions of ANCOVA were met. The following table and figures are the selected output from Dr. Green's analysis ( = .05):
Tests of Between-Subjects Effects
Dependent Variable: Language
Source Type III Sum of Squares df Mean Square F Sig. Sign 22681.088 1 22681.088 5.963 .020 Hearing 3084.607 1 3084.607 .811 .374 Sign*Hearing 23130.912 1 23130.912 6.082 .019 Error 136920.190 36 3803.339 Corrected Total 162488.375 39
 a. What assumption is being evaluated here?
b. Was this assumption satisfied? If not, what effect might it have on the results of ANCOVA?
a. What assumption is being evaluated here?
b. Was this assumption satisfied? If not, what effect might it have on the results of ANCOVA?
a. The assumption of homogeneous slopes is being evaluated.
b. The interaction between signing (factor) and hearing (covariate) is significant (F = 6.082, p = .019). Moreover, the scatterplots of Y vs. X suggest that the regression slopes differ between two groups (i.e., children who learned sign language and those who did not). Therefore, the assumption of homogeneous slopes seems to be violated.
With heterogeneous slopes, the size of the group differences in Y (i.e., children's language skills) will depend on the value of X (i.e., children's hearing). For example, learning to sign may be helpful for children with worse hearing, but not for children with better hearing. In this case, a straightforward interpretation of the ANCOVA would be misleading.
The use of w can yield biased adjusted means and can affect the F test. Considering the study is probably not a randomized experiment, the violation of this assumption may have a modest effect on the results of the F test.
Barbara wants to know whether students will learn most effectively with soft music as background sound, as opposed to loud music or no music at all. In the following table are three independent random samples (different background sounds) of paired values on the covariate (X; pretest score) and the dependent variable (Y; posttest score). Conduct an ANOVA on Y, an ANCOVA on Y using X as a covariate, and compare the results ( = .05). Determine the unadjusted and adjusted means.
Sott Music X Y 75 89 42 49 34 52 61 70 45 66 70 83 75 90 58 73
Loud Music X Y 75 89 42 49 34 52 61 70 45 66 70 83 75 90 58 73
No Music X Y 75 89 42 49 34 52 61 70 45 66 70 83 75 90 58 73
Procedure:
Create a data set with three variables: Pretest (covariate), Posttest (dependent variable), and Music (factor with 3 levels). The data set should have 24 cases. Other steps are similar to those in Question 3.
Use Posttest as the Dependent Variable, Music as the Fixed Factor, and Pretest as the Covariate.
Selected SPSS Output:
I. ANOVA Results:
Tests of Between-Subjects Effects
Dependent Variable: Posttest
Unadjusted Means
Dependent Variable: Posttest
II. ANCOVA Results:
Tests of Between-Subjects Effects
Dependent Variable: Posttest
Unadjusted Means
Dependent Variable: Posttest
A one-factor fixed-effects ANOVA was first conducted. As shown in the table of unadjusted means, students who studied without any background music had the highest posttest mean score (73.25), followed by those who listened to soft music (71.5), and those who listened to loud music (59.25). The ANOVA table showed that background music did not have any significant effect on posttest scores (F = 2.352, df = 2, 21, p = .12). Effect size was large (partial ?2 = .183), but the observed power was not adequate (.422).
A one-factor ANCOVA was also conducted on the same data. As shown in the table of adjusted means, after adjusting for group differences in pretest scores, the mean was highest for students who listened to soft music (70.21), followed by students who studied without music (69.04), and students who listened to loud music (64.75).
The one-factor ANCOVA table showed that the effects of background music on posttest score after adjusting for pretest score was nonsignificant at = .05 (F = 2.98, df = 2, 20, p = .073), with a large effect size yet inadequate power (partial 2 = .23, power = .515). The slope of Pretest (i.e., the covariate) was significantly different from zero (F = 221.06, df = 1, 20, p < .001), suggesting that pretest score is closely related to the posttest scores.
After pretest score is included as covariate in the model, the means for Group 1 and Group 3 were adjusted to be lower than their raw mean, whereas the mean for Group 2 was adjusted to be higher than its raw mean. The use of the covariate resulted in a reduction of error variance and increased the power for the F test.
In ANCOVA, suppose Y is the dependent variable, X is the covariate, and the factor has two levels. Also, all assumptions of ANCOVA are met. Which of the following situations is the most desirable?
The covariate in ANCOVA serves as which one of the following?
A researcher wanted to examine if soil type had any effects on the heights of daylilies. Ten bulbs of daylilies were planted in each of the three different types of soil. The thickness of the soil X) was also measured for each pot. After three months, the heights of the plants
Y) were measured. Below are the group means of the study.
 -If ANCOVA is used, which group will have the highest adjusted mean height?
In ANCOVA, which of the following is a source of variation not controlled for when designing the experiment but that the researcher believes to affect the outcome?
A researcher wanted to examine if soil type had any effects on the heights of daylilies. Ten bulbs of daylilies were planted in each of the three different types of soil. The thickness of the soil X) was also measured for each pot. After three months, the heights of the plants
Y) were measured. Below are the group means of the study.
-If there is a substantial negative correlation between X and Y, the error variation for ANCOVA as compared to that for ANOVA will be
A market researcher wanted to know whether different package designs for the same yogurt product would affect consumers' purchase intention. There were four different versions of package designs. Each package was viewed by eight participants, who then rated their likelihood to purchase the product. A one-factor ANCOVA was used to analyze the data where the covariate was the participants' liking of the yogurt product in general. Complete the following ANCOVA summary table ( = .05):
Source SS df MS F Critical Value Decision Between adjusted 10.5 - - - - - Within adjusted - - - - - - Covariate - 5.6 - - - Total - -
For which of the following situations is it appropriate to use ANCOVA?
Susan runs an ANOVA using the covariate X as the dependent variable and the factor A as the independent variable. Now using Y as the dependent variable, Susan runs another ANOVA to evaluate if there is any interaction between the covariate X and the factor A. For , which of the following situations is the most desirable?
Suppose out of budget concerns, the researcher included only five participants in each group, tested each participant twice, and used each time as separate observations. It seems likely that
A researcher wanted to examine if soil type had any effects on the heights of daylilies. Ten bulbs of daylilies were planted in each of the three different types of soil. The thickness of the soil X) was also measured for each pot. After three months, the heights of the plants
Y) were measured. Below are the group means of the study.
-If there is no correlation between X and Y, the MSwith for ANCOVA as compared to that for ANOVA will be
Mike wanted to examine whether people remembered information better with auditory cues or with visual cues. He recruited 14 participants and randomly assigned seven participants to each of the two groups: one group heard a list of words from headphones, and the other group saw the same list of words from the screen. The participants were then asked to write down as many words as they could remember. The dependent variable was the number of words correctly remembered (Y), and the covariate was the participants' score on a memory test (X) administered before the experiment. Using the data below, conduct an ANOVA on Y and an ANCOVA on Y using X as a covariate, and compare the results ( = .05). Determine the unadjusted and adjusted means.
Auditory Cue (Headphone) Visual Cue (Screen) X Y X Y 80 10 75 13 75 9 90 20 95 16 65 8 60 4 70 9 70 11 80 15 65 8 85 13 90 15 75 12
A researcher wanted to examine if soil type had any effects on the heights of daylilies. Ten bulbs of daylilies were planted in each of the three different types of soil. The thickness of the soil X) was also measured for each pot. After three months, the heights of the plants
Y) were measured. Below are the group means of the study.
-If the correlation between X and Y is 0.5 for soil type 1, 0.1 for soil type 2, and ?0.5 for soil type 3, it seems likely that
A researcher wanted to examine if soil type had any effects on the heights of daylilies. Ten bulbs of daylilies were planted in each of the three different types of soil. The thickness of the soil X) was also measured for each pot. After three months, the heights of the plants
Y) were measured. Below are the group means of the study.
-If there is a substantial, positive correlation between the thickness of soil (X) and the height of daylilies (Y), which group will have the highest adjusted mean height?
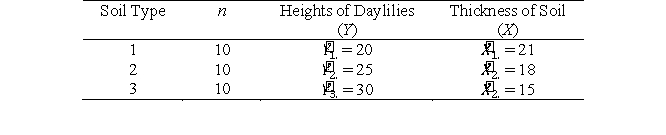
A researcher wanted to examine if soil type had any effects on the heights of daylilies (Y). The thickness of the soil (X) in the pot was used as the covariate X. Given the data that follow, where there are three types of soil (n = 10 in each group), (a) calculate the adjusted mean values assuming that bw = 0.5, and (b) determine what effects the adjustment had on the posttest results.
Soil Type Heights of Daylilies (Y) Thickness of Soil 1 =20 =21 2 =25 =18 3 =30 =15
Suppose the researcher used IQ as the covariate. He then found that the mean IQ is slightly different across two groups, and people with higher IQ tended to remember more words than people with lower IQ. It seems likely that
In a one-factor ANCOVA, suppose the factor has two levels (groups). Scatterplots of the dependent variable (Y) and the covariate (X) are generated (where group 1 is indicated by "•" and group 2 by "o"). Which of the following graphs shows the most desirable situation?
Filters
- Essay(0)
- Multiple Choice(0)
- Short Answer(0)
- True False(0)
- Matching(0)