Exam 4: Regression
Exam 1: Picturing Distributions With Graphs38 Questions
Exam 2: Describing Quantitative Distributions With Numbers42 Questions
Exam 3: Scatterplots and Correlation42 Questions
Exam 4: Regression41 Questions
Exam 5: Two-Way Tables35 Questions
Exam 6: Samples and Observational Studies34 Questions
Exam 7: Designing Experiments40 Questions
Exam 8: Essential Probability Rules58 Questions
Exam 9: Independence and Conditional Probabilities38 Questions
Exam 10: The Normal Distributions43 Questions
Exam 11: Discrete Probability Distributions43 Questions
Exam 12: Sampling Distributions48 Questions
Exam 13: Introduction to Inference48 Questions
Exam 14: Exercises44 Questions
Exam 15: Inference About a Population Mean44 Questions
Exam 16: Comparing Two Means40 Questions
Exam 17: Inference About a Population Proportion39 Questions
Exam 18: Comparing Two Proportions47 Questions
Exam 19: The Chi-Square Test for Goodness of Fit40 Questions
Exam 20: The Chi-Square Test for Two-Way Tables42 Questions
Exam 21: Inference for Regression45 Questions
Exam 22: One-Way Analysis of Variance: Comparing Several Means40 Questions
Exam 23: More About Analysis of Variance: Follow-Up Tests and Two-Way Anova39 Questions
Exam 24: Nonparametric Tests41 Questions
Exam 25: Multiple and Logistic Regression28 Questions
Select questions type
John's parents recorded his height at various ages up to 66 months. Following is a record of their results:
?
?
Age (months) 36 48 54 60 66 Height (inches) 35 38 41 43 45 John's parents decide to use the least-squares regression line of John's height (y) on age (x) based on these data to predict his height at age 21 years. What can we conclude based on this information?
(Multiple Choice)
4.8/5  (34)
(34)
Tail-feather length in birds is sometimes a sexually dimorphic trait. That is, the trait differs substantially for males and for females. Researchers studied the relationship between tail-feather length (measuring the R1 central tail feather) and weight in a sample of 20 male long-tailed finches raised in an aviary. The data are represented in the following scatterplot, along with the least-squares regression line equation and the square of the correlation coefficient (R2).
 What would be the predicted tail-feather length of a male long-tailed finch weighing 20 g?
(Multiple Choice)
4.8/5 (45)
What can we conclude if the square of the correlation coefficient is close to 1?
(Multiple Choice)
4.8/5 (42)
Suppose we fit the least-squares regression line to a set of data. What do we call points with unusually large values of the residuals?
(Multiple Choice)
4.9/5 (46)
One of nature's patterns connects the percent of adult birds in a colony that return from the previous year and the number of new adults that join the colony. Here are data for 13 colonies of sparrowhawks (a type of bird) and the software output:
?
?
Percent return 74 66 81 52 73 62 52 45 62 46 60 46 38 New adults 5 6 8 11 12 15 16 17 18 18 19 20 20
Simple linear regression results:
Dependent Variable: New adults
Independent Variable: percentage return
New adults percentage return
Sample size: 13
(correlation coefficient
Estimate of error standard deviation:
Parameter estimates:
Parameter Estimate Std. Err. Alternative DF T-Stat P-value Intercept 31.934259 4.8376164 0 11 6.6012383 <0.0001 Slope -0.30402295 0.081220034 0 11 -3.7432014 0.0032 A scatterplot of the data shows that there is a linear relationship between the percent x of adult sparrowhawks that return to a colony from the previous year and the number y of new adult birds that join the colony.
An ecologist uses regression line, y = 31.934 - 0.304x to predict how many birds will join another colony when 50% of the adults from the previous year return. What is the prediction?
(Multiple Choice)
4.8/5 (36)
What is the best description of a least-squares regression line?
(Multiple Choice)
4.9/5 (42)
Before surgical removal of a diseased parathyroid gland, two tests are often performed: the standard intact test and the turbo test. Both tests measure parathyroid hormone (PTH, in ng/l), but the turbo test is very expensive. Researchers obtained data from both tests in a sample of 48 patients to predict turbo test results (y) from standard intact test results (x). The data ranged from roughly 0 to 500 ng/l, and a scatterplot showed a clear linear relationship. The published findings are summarized exactly as follows:
Y = 1.08x - 4.36 (r = 0.97; n = 48)
Roughly what percent of the variation in turbo test results can be explained by this regression model?
(Multiple Choice)
4.8/5 (39)
Before surgical removal of a diseased parathyroid gland, two tests are often performed: the standard intact test and the turbo test. Both tests measure parathyroid hormone (PTH, in ng/l), but the turbo test is very expensive. Researchers obtained data from both tests in a sample of 48 patients to predict turbo test results (y) from standard intact test results (x). The data ranged from roughly 0 to 500 ng/l, and a scatterplot showed a clear linear relationship. The published findings are summarized exactly as follows:
Y = 1.08x - 4.36 (r = 0.97; n = 48)
What is the slope of the regression line?
(Multiple Choice)
4.9/5 (33)
Tail-feather length in birds is sometimes a sexually dimorphic trait. That is, the trait differs substantially for males and for females. Researchers studied the relationship between tail-feather length (measuring the R1 central tail feather) and weight in a sample of 20 male and 21 female long-tailed finches raised in an aviary.
 What is a practical interpretation of the slope estimate of the least squares regression line for males (blue squares)?
(Multiple Choice)
4.8/5 (31)
In a study of diet, the amount of weight lost and the starting weight for each individual was recorded. A scatterplot of the data is provided. The correlation between weight lost and starting weight was computed to be 0.934.
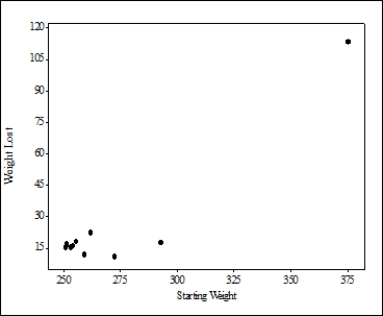 Because the correlation between starting weight and weight lost is so high, what can we conclude?
(Multiple Choice)
4.9/5 (46)
Tail-feather length in birds is sometimes a sexually dimorphic trait. That is, the trait differs substantially for males and for females. Researchers studied the relationship between weight (x) and tail-feather length (y) in a sample of five wild, male long-tailed finches. Here are the data and software output:
weight () tail length () 20.8 82.5 19.1 82.5 15.9 67.0 16.7 70.5 15.7 73.5 Simple linear regression results:
Dependent Variable: tail length
Independent Variable: weight
tail length weight
Sample size: 5
(correlation coefficient
Estimate of error standard deviation:
Parameter estimates:
Parameter Estimate Std. Err. Alternative DF T-Stat P-value Intercept 25.547393 14.928136 0 3 1.7113585 0.1855 Slope 2.8147736 0.84093435 0 3 3.3471979 0.0442 What is the value of the slope for the least-squares regression line based on these data?
(Multiple Choice)
4.8/5 (36)
A researcher wants to determine whether the rate of water flow (in liters per second) over an experimental soil bed can be used to predict the amount of soil washed away (in kilograms). The researcher measures the amount of soil washed away for various flow rates and, from these data, calculates the least-squares regression line to be amount of eroded soil = 0.4 + 1.3 × (flow rate)
What can be concluded about the correlation between amount of eroded soil and flow rate?
(Multiple Choice)
4.8/5 (38)
A researcher noticed that, for streams along the East Coast, the amount of money spent on restoration and the number of distinct fish populations present appeared to have a negative correlation.
To investigate this observed association, how should the researcher begin his research?
(Multiple Choice)
4.7/5 (43)
Tail-feather length in birds is sometimes a sexually dimorphic trait. That is, the trait differs substantially for males and for females. Researchers studied the relationship between tail-feather length (measuring the R1 central tail feather) and weight in a sample of 20 male long-tailed finches raised in an aviary. The data are represented in the following scatterplot, along with the least-squares regression line equation and the square of the correlation coefficient (R2).
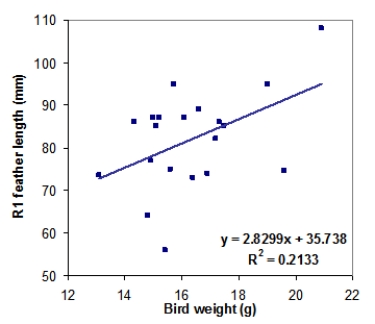 What is the value of the correlation coefficient describing the relationship between weight and tail-feather length?
(Multiple Choice)
4.7/5 (26)
Before surgical removal of a diseased parathyroid gland, two tests are often performed: the standard intact test and the turbo test. Both tests measure parathyroid hormone (PTH, in ng/l), but the turbo test is very expensive. Researchers obtained data from both tests in a sample of 48 patients to predict turbo test results (y) from standard intact test results (x). The data ranged from roughly 0 to 500 ng/l, and a scatterplot showed a clear linear relationship. The published findings are summarized exactly as follows:
Y = 1.08x - 4.36 (r = 0.97; n = 48)
For a PTH level of x = 100 ng/l with the standard intact test, what is the predicted PTH level with the turbo test?
(Multiple Choice)
4.9/5 (34)
Researchers examined hormonal changes in women during the menopausal years. They found a weak linear relationship between age (in years) and the six-month percent change in plasma level of the reproductive hormone LH. Software gave the following output for the least-squares regression analysis:
Predictor Coef SE Coef T P
Constant 101.46 79.05 1.28 0.207
Age -1.627 1.559 -1.04 0.303
S = 41.5236 R-Sq = 2.9% R-Sq(adj) = 0.2%
Based on this output, what is the equation for the least-squares regression line?
(Multiple Choice)
4.8/5 (37)
In a study of diet, the amount of weight lost and the starting weight for each individual was recorded. A scatterplot of the data is provided. The correlation between weight lost and starting weight was computed to be 0.934.
 What can be conclude about these data?
(Multiple Choice)
4.9/5 (41)
Tail-feather length in birds is sometimes a sexually dimorphic trait. That is, the trait differs substantially for males and for females. Researchers studied the relationship between tail-feather length (measuring the R1 central tail feather) and weight in a sample of 20 male long-tailed finches raised in an aviary. The data are represented in the following scatterplot, along with the least-squares regression line equation and the square of the correlation coefficient (R2).
 What is the value of the slope for the male regression line?
(Multiple Choice)
4.8/5 (38)
Babies typically learn to crawl approximately 6 months after birth. However, it may take longer for babies to learn to crawl in the winter, when they are often bundled in clothes that restrict their movement. Thus, there may be an association between a baby's crawling age and the average temperature during the month they first try to crawl. Below are the average ages (in weeks) at which babies began to crawl for a sample of babies born in each of the 12 months of the year. In addition, the average temperature (in °F) for the month that is 6 months after the birth month is listed.
?
?
Birth month Average crawling age Average temperature January 29.84 66 February 30.52 73 March 29.70 72 April 31.84 63 May 28.58 52 June 31.44 39 July 33.64 33 August 32.82 30 September 33.83 33 October 33.35 37 November 33.38 48 December 32.32 57 We want to investigate whether the average age at which infants begin to crawl (y) can be predicted from the average outdoor temperature (x) 6 months after birth, when the babies are likely to begin crawling. We decide to fit a least-squares regression line to the data, with x as the explanatory variable and y as the response variable. We compute the following quantities:
R = correlation between x and y = -0.7
X?= mean of the values of x = 50.25
?= mean of the values of y = 31.77
Sx = standard deviation of the values of x = 15.85
Sy = standard deviation of the values of y = 1.76
The correlation between the crawling age and height of children is found to be about r = 0.7. Suppose we use the crawling age x of a child to predict the height y of the child from a least-squares regression line. What can we conclude?
(Multiple Choice)
4.9/5 (30)
Tail-feather length in birds is sometimes a sexually dimorphic trait. That is, the trait differs substantially for males and for females. Researchers studied the relationship between tail-feather length (measuring the R1 central tail feather) and weight in a sample of 20 male and 21 female long-tailed finches raised in an aviary.
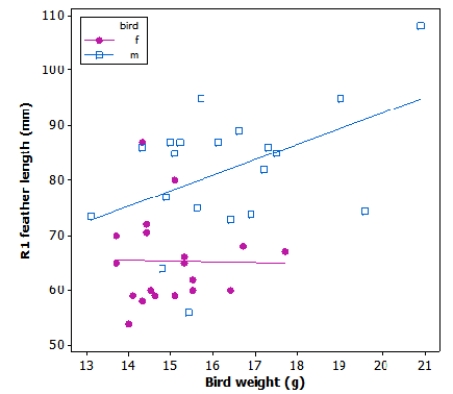 The linear correlation coefficient (r) between weight and tail-feather length in male long-tailed finches is 0.46. Approximately what percent of variation in tail-feather length can be explained by weight among male long-tailed finches?
(Multiple Choice)
4.8/5 (44)
Filters
- Essay(0)
- Multiple Choice(0)
- Short Answer(0)
- True False(0)
- Matching(0)