Exam 13: Introduction to Inference
Exam 1: Picturing Distributions With Graphs38 Questions
Exam 2: Describing Quantitative Distributions With Numbers42 Questions
Exam 3: Scatterplots and Correlation42 Questions
Exam 4: Regression41 Questions
Exam 5: Two-Way Tables35 Questions
Exam 6: Samples and Observational Studies34 Questions
Exam 7: Designing Experiments40 Questions
Exam 8: Essential Probability Rules58 Questions
Exam 9: Independence and Conditional Probabilities38 Questions
Exam 10: The Normal Distributions43 Questions
Exam 11: Discrete Probability Distributions43 Questions
Exam 12: Sampling Distributions48 Questions
Exam 13: Introduction to Inference48 Questions
Exam 14: Exercises44 Questions
Exam 15: Inference About a Population Mean44 Questions
Exam 16: Comparing Two Means40 Questions
Exam 17: Inference About a Population Proportion39 Questions
Exam 18: Comparing Two Proportions47 Questions
Exam 19: The Chi-Square Test for Goodness of Fit40 Questions
Exam 20: The Chi-Square Test for Two-Way Tables42 Questions
Exam 21: Inference for Regression45 Questions
Exam 22: One-Way Analysis of Variance: Comparing Several Means40 Questions
Exam 23: More About Analysis of Variance: Follow-Up Tests and Two-Way Anova39 Questions
Exam 24: Nonparametric Tests41 Questions
Exam 25: Multiple and Logistic Regression28 Questions
Select questions type
A company manufactures U-100 insulin syringes designed to contain 1 milliliter (ml) of a solution containing insulin. The actual distribution of solution volumes in these syringes is Normal, with mean? and standard deviation ?= 0.05 ml. We randomly select 8 syringes and measure the volume of solution in each. The results of these 8 measurements (in ml) are as follows:
?
1.05 1.04 1.06 1.01 0.98 0.98 1.03 0.99 Do these data give evidence that the true population mean solution volume is not 1 m1? What is the P-value for the appropriate null and alternative hypotheses?
(Multiple Choice)
4.7/5  (35)
(35)
The scores of a certain population on the Wechsler Intelligence Scale for Children IV (WISC IV) are thought to be Normally distributed, with mean μ and standard deviation σ= 15. Bill is a child psychologist who obtains a simple random sample of 25 children from this population; each child is given the WISC IV. Suppose a histogram of the 25 WISC scores is the following:
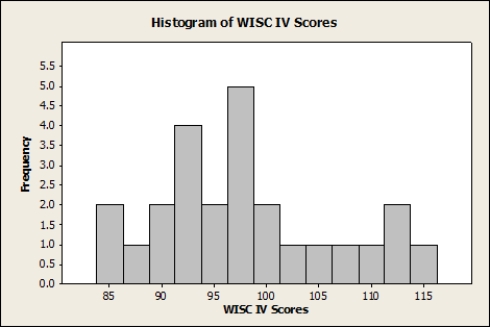 Bill calculates a 95% confidence interval for μ and finds it to be (98.42, 110.20). What should Bill conclude about the 95% confidence interval?
(Multiple Choice)
4.9/5 (40)
A medical researcher treats 100 subjects with high cholesterol levels with a new drug. The average decrease in cholesterol level is x̄= 80 after two months of taking the drug. Assume that the decrease in cholesterol after two months of taking the drug follows a Normal distribution, with unknown mean μ and standard deviation σ= 20. What is the 90% confidence interval for μ based on these data?
(Multiple Choice)
4.9/5 (39)
When does a level α two-sided significance test reject the null hypothesis H0: μ= μ0?
(Multiple Choice)
4.7/5 (37)
Twenty-five patients at a large clinic volunteer to participate in a study focusing on weight loss. These 25 patients had a mean weight loss score of x̄= 4500 g over two weeks. Suppose we know that the standard deviation of the population of weight changes on this particular diet is σ= 100 g. Assume the population of weight losses is approximately Normally distributed. What is a 90% confidence interval for the mean weight loss μ for the population, based on the collected data?
(Multiple Choice)
4.8/5 (37)
The level of nitrogen oxides (NOx) in the exhaust of cars of a particular model varies Normally, with standard deviation σ= 0.05 gram per mile (g/mi). A random sample of 12 cars of this particular model is taken and is found to have a mean NOx emission of x̄= 0.298 g/mi. Government regulations call for NOx emissions no higher than 0.3 g/mi. Do the data provide evidence that this particular model meets the government regulation? What should you conclude from these data?
(Multiple Choice)
4.9/5 (35)
A certain population follows a Normal distribution with mean μ and standard deviation σ= 2.5. You collect data and test the following hypotheses:
H0: μ= 1 versus Ha: μ≠1
You obtain a P-value of 0.022. Which of the following statements is TRUE?
(Multiple Choice)
4.8/5 (29)
The level of nitrogen oxides (NOx) in the exhaust of cars of a particular model varies Normally, with standard deviation σ= 0.05 gram per mile (g/mi). A random sample of 12 cars of this particular model is taken and is found to have a mean NOx emission of x̄= 0.298 g/mi. Government regulations call for NOx emissions no higher than 0.3 g/mi. Do the data provide evidence that this particular model meets the government regulation? What is the P-value for the appropriate null and alternative hypotheses?
(Multiple Choice)
4.8/5 (39)
Filters
- Essay(0)
- Multiple Choice(0)
- Short Answer(0)
- True False(0)
- Matching(0)