Exam 13: Analyzing Your Data I: an Overview
Exam 1: Introduction to Research Methods44 Questions
Exam 2: The Ethical Imperative45 Questions
Exam 3: Negotiating the Institutional Review Board Process45 Questions
Exam 4: Starting Your Research45 Questions
Exam 5: Focusing Your Question and Choosing a Design43 Questions
Exam 6: Developing Your Research Protocol44 Questions
Exam 7: Survey and Interview Approaches30 Questions
Exam 8: Experimental Designs43 Questions
Exam 9: Variations on Experimental Designs42 Questions
Exam 10: Observation, Case Studies, Archival Research, and Meta-Analysis45 Questions
Exam 11: Neuroscience Methods45 Questions
Exam 12: Research Over Age and Time44 Questions
Exam 13: Analyzing Your Data I: an Overview44 Questions
Exam 14: Analyzing Your Data II: Specific Approaches45 Questions
Exam 15: Writing up Your Results46 Questions
Exam 16: Publishing Your Research43 Questions
Select questions type
The probability of committing a Type I error is the same as the alpha level of a study.
(True/False)
4.7/5  (37)
(37)
Stephanie is designing an experiment to investigate the effect of listening to calming music on positive emotions. Even though the usual alpha level is 0.05, Stephanie feels that she wants to adopt more stringent criteria for her study, so she chooses an alpha level of 0.01. This strategy reduces the probability of:
(Multiple Choice)
4.9/5 (28)
Stem-and-leaf plots are most suited for displaying data sets that are ___________ while histograms can display data sets that are ________________.
(Multiple Choice)
4.9/5 (28)
In Alison's study, the Pearson's r of participants' caffeine consumption (milligrams) and their reaction time (milliseconds) on a computer task is -0.22. This means that…
(Multiple Choice)
4.8/5 (35)
The plot below describes the relationship between the time spent in hours watching television per week (y-axis) and the time it takes to run half a mile in minutes (x-axis) in a sample of individuals.
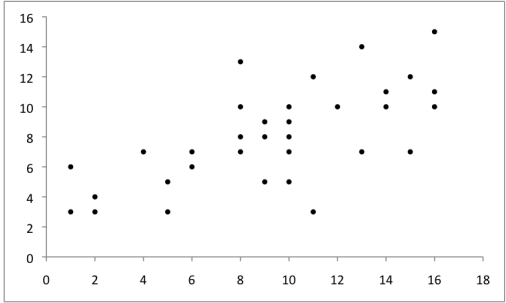 Does the graph illustrate a univariate or bivariate display? What does the graph tell you about the relationship between the two variables?
(Essay)
4.7/5 (28)
Which of the following groups of data can you compute a confidence interval for?
(Multiple Choice)
4.9/5 (34)
Which of the following is true when thinking about statistical significance and effect sizes?
(Multiple Choice)
4.8/5 (35)
Which of the following is a valid reason for focusing on effect size instead of p values when analyzing your results?
(Multiple Choice)
4.9/5 (31)
The data below are from Jason's study measuring how much college students use social media per week (in hours):
0; 0; 3; 3; 7; 7; 7; 11; 12; 15; 15; 18; 21; 23; 23; 28; 30; 31; 31; 35
Display the data in a stem-and-leaf plot and a histogram. List an advantage and disadvantage of using a stem-and-leaf plot.
(Essay)
4.8/5 (30)
State two criticisms of null hypothesis significance testing and a solution to each of the criticisms.
(Essay)
4.9/5 (26)
Define a confidence interval. Describe the relationship between the width of a confidence interval and sample size, and the relationship between p values and sample size.
(Essay)
4.7/5 (35)
Which of the following is true about Type II error of a test?
(Multiple Choice)
4.8/5 (42)
Sampling distributions of means will always tend towards a normal distribution with increasing sample size, even if the distribution of the underlying population is bimodal.
(True/False)
4.7/5 (30)
What is a guaranteed outcome of increasing your sample size?
(Multiple Choice)
4.9/5 (42)
For sampling distributions, a larger sample size gives a more precise estimate of the mean.
(True/False)
4.8/5 (31)
Which of the following information can you get from inferential statistics that you cannot obtain from descriptive statistics?
(Multiple Choice)
4.7/5 (37)
The mode is the most common value in a data set. It is a measure of:
(Multiple Choice)
4.9/5 (35)
Which of the following cannot properly display data on interval scales?
(Multiple Choice)
4.9/5 (40)
Filters
- Essay(0)
- Multiple Choice(0)
- Short Answer(0)
- True False(0)
- Matching(0)