Exam 5: Measurement: Linking Theory to Research
Levels of measurement indicate the inferences that can be drawn when comparing one category or value of a variable with another: Do they differ? Is one ranked higher than the other? What is the numerical difference? What is the ratio of the values? Identify the four levels of measurement. Then, for each level describe the inferences that can be made when comparing units (e.g., people) who are in different variable categories.
The four levels of measurement are nominal, ordinal, interval, and ratio.
1. Nominal level: This level of measurement involves categorizing data into distinct groups or labels. Inferences that can be made when comparing units in different variable categories at the nominal level are limited to determining whether the categories are different or the same. For example, if comparing different genders (male and female), the inference that can be made is simply whether the genders are different or the same.
2. Ordinal level: At this level, data is ranked or ordered based on a specific criterion. Inferences that can be made when comparing units in different variable categories at the ordinal level include determining the ranking or order of the categories. For example, if comparing educational levels (e.g., high school, college, graduate school), the inference that can be made is the ranking of these categories from lowest to highest.
3. Interval level: This level of measurement involves data that has a specific order and equal intervals between values, but does not have a true zero point. Inferences that can be made when comparing units in different variable categories at the interval level include determining the numerical difference between the categories. For example, when comparing temperature in Celsius, the inference that can be made is the numerical difference between two temperature values.
4. Ratio level: This level of measurement includes data with a specific order, equal intervals between values, and a true zero point. Inferences that can be made when comparing units in different variable categories at the ratio level include determining the ratio of the values. For example, when comparing income levels, the inference that can be made is the ratio of one income level to another.
In summary, the levels of measurement indicate the types of inferences that can be made when comparing different variable categories, ranging from simply determining whether categories are different or the same at the nominal level, to calculating the ratio of values at the ratio level.
The feedback loop in the measurement process
A
The feedback loop in the measurement process reflects the inductive logic of inquiry.
True
According to Box 5.3, scales differ from indexes in terms of
In Pager's study of the impact of criminal record on employment opportunity, what type of operational definition did she use to measure employment opportunity?
Explain how construct validation (a) depends on the theory underlying the concept that is being measured, and (b) is based on an accumulation of evidence.
According to Box 5.3, Guttman scaling is a method of constructing a unidimensional scale.
Explain how the text's example of a recipe for carrot cake illustrates an operational definition in social research. What are the recipe ingredients analogous to in social measurement? What do the steps for combining ingredients and baking the cake illustrate about an operational definition?
Refer to Figure 5.2.
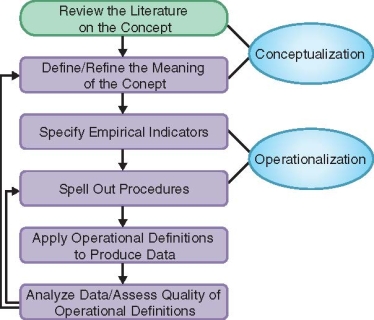 Using this figure as a reference, discuss how this process reflects the cyclical relationship between theory and data in science. What part of the figure reflects the deductive logic of inquiry? What part reflects the inductive logic of inquiry?
According to Box 5.4, the social desirability effect refers to
According to Box 5.3, a researcher creates a composite measure of attitudes toward research methods consisting of 20 statements with which respondents indicate their level of agreement or disagreement (strongly agree to strongly disagree). The researcher's measure is an example of
The first steps in the measurement process-conceptualization and operationalization-follow the deductive model of inquiry.
Sociologists Richard Schwartz and James Miller proposed that changes in societies' legal systems parallel changes in societal complexity (or, in Durkheim's terms, the societal "division of labor"). Fully developed legal systems are seen to have the following three characteristics:
a. Mediation: regular use of third parties to settle disputes
b. Police: use of specialized, armed force to enforce laws
c. Counsel: regular use of specialized, non-kin advocates (e.g., lawyers)
According to Box 5.4, the social desirability effect lowers measurement validity.
According to Box 5.1, creating an index by adding together multiple indicators of a concept
According to Box 5.3, indexes and scales are types of composite measures.
Describe the relationship between reliability and validity. (Note: Your description should answer the following two questions: Is it possible to have a reliable but invalid measure? Is it possible to have an unreliable but valid measure?)
The data source for surveys consists of _______; a primary data source for the analysis of existing data is _______.
Filters
- Essay(0)
- Multiple Choice(0)
- Short Answer(0)
- True False(0)
- Matching(0)