Exam 12: Quantitative Data Analysis: Using Statistics for Description and Inference
Exam 1: Introduction: Why Care About Research Methods?12 Questions
Exam 2: Science and Social Research: From Theory to Data and Back34 Questions
Exam 3: The Ethics and Politics of Research: Doing What's "Right"22 Questions
Exam 4: Research Designs: It Depends on the Question30 Questions
Exam 5: Measurement: Linking Theory to Research19 Questions
Exam 6: Sampling: Case Selection as a Basis for Inference17 Questions
Exam 7: Experiments: What Causes What?18 Questions
Exam 8: Surveys: Questioning and Sampling22 Questions
Exam 9: Field Research and In-Depth Interviews: Systematic People-Watching and Listening38 Questions
Exam 10: Existing Data Analysis: Using Data from Secondhand Sources35 Questions
Exam 11: Multiple Methods: Two or More Approaches Are Better Than One38 Questions
Exam 12: Quantitative Data Analysis: Using Statistics for Description and Inference23 Questions
Exam 13: Qualitative Data Analysis: Searching for Meaning46 Questions
Exam 14: Reading and Writing in Social Research: It's All About Communication9 Questions
Select questions type
According to Box 12.3, "collinearity" refers to a perfect linear fit between the independent and dependent variables.
Free
(True/False)
4.8/5  (28)
(28)
Correct Answer: Verified
False
For the 2018 GSS, you regress number of hours of television watched on the average day (Y) on number of years of education completed (X) and obtain the following result:
Y = 4.78 - .15X. How much change in hours of television watched is associated with a change of one year in a respondent's education?
Free
(Multiple Choice)
4.8/5 (34)
Correct Answer:Verified
D
Some data-processing activities can be programmed into computer-assisted interviewing.
Free
(True/False)
4.9/5 (35)
Correct Answer:Verified
True
Which of the following most accurately describes Singleton's study of alcohol consumption and academic performance?
(Multiple Choice)
4.9/5 (46)
Suppose a researcher finds a statistically significant relationship between salary and job satisfaction among a random sample of employees. From this information, she can
(Multiple Choice)
4.7/5 (40)
Using the 2018 GSS, we regressed the number of hours of television watched on the average day on three variables: years of education, age, and marital status. Marital status is a dummy variables with 1 = married. We get the following results for the unstandardized regression coefficients: TVhours = 3.38 - .13Educ + .03Age - .52Married. According to this equation,
(Multiple Choice)
4.9/5 (32)
Univariate analysis can determine whether to recode variable categories for further analysis.
(True/False)
4.8/5 (25)
Suppose two variables are negatively related. Which of the following regression equations might describe this relationship?
(Multiple Choice)
4.7/5 (28)
Describe the differences in the bivariate analysis of nominal/ordinal variables and interval/ratio variables. What descriptive and inferential statistics are used to describe each type of variable?
(Essay)
4.7/5 (35)
Examining a scatterplot can reveal whether a linear regression analysis is appropriate.
(True/False)
5.0/5 (40)
Using the 2018 GSS, we regressed the number of hours of television watched on the average day on three variables: years of education, age, and marital status. Marital status is a dummy variables with 1 = married. We get the following results for the standardized regression coefficients: TVhours = - .16Educ + .20Age - .10Married. According to this equation,
(Multiple Choice)
4.8/5 (39)
Using the 2018 GSS, we regressed the number of hours of television watched on the average day on three variables: years of education, age, and marital status. Marital status is a dummy variables with 1 = married. We get the following results for the unstandardized regression coefficients: TVhours = 3.38 - .13Educ + .03Age - .52Married. What is the predicted number of hours of television viewing for a 20-year old, unmarried person with 14 years of education?
(Multiple Choice)
4.9/5 (36)
What is the usual order of steps in processing completed survey interviews or questionnaires?
(Multiple Choice)
4.8/5 (34)
Refer to the following table.
Table 1. Percentage of Respondents Expressing High Tolerance of Civil Liberties for Political
Dissidents, by Gender and Religiosity
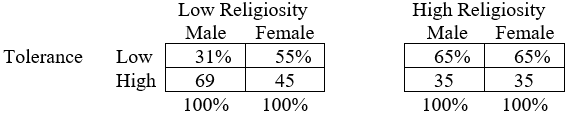 Which variable(s) is (are) controlled, or held constant, in each partial table of Table 1?
(Multiple Choice)
4.7/5 (26)
What is the order of steps in the quantitative analysis of survey data?
(Multiple Choice)
4.7/5 (40)
The quality of data is affected at several stages of social research, including data processing. What techniques do survey researchers apply to avoid errors and enhance data quality during data processing? Are data processing errors unavoidable, like random sampling error? Explain.
(Essay)
4.8/5 (32)
Consider the following table from the 2018 GSS, which shows the relationship between race and whether someone favors or opposes "a law which would require a person to obtain a police permit before he or she could buy a gun."
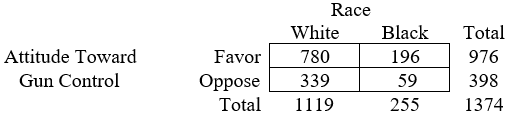 The data in this table suggest that (the answer may require some calculation)
(Multiple Choice)
4.9/5 (38)
According to Box 12.3, leaving out important variables from a model is called a "specification error."
(True/False)
4.9/5 (38)
Someone at your college conducts a survey on helping and voluntarism. Suppose you are consulted about how to analyze the data to test the hypothesis that students majoring in the arts are more likely to do volunteer work than students majoring in the sciences. (a) What questions would you ask about the data before you make your recommendations? (b) As you might point out, why is a bivariate analysis seldom, if ever, sufficient to test a hypothesis that one variable causes another? (c) As you might explain, how is multiple regression superior to elaboration?
(Essay)
4.9/5 (29)
Filters
- Essay(0)
- Multiple Choice(0)
- Short Answer(0)
- True False(0)
- Matching(0)