Exam 18: Correlation and Regression
Exam 1: Research Questions, Design, Strategy and Choice of Methods20 Questions
Exam 2: Ethics20 Questions
Exam 3: Big Questions and New Methods20 Questions
Exam 4: Capturing and Recording Information20 Questions
Exam 5: Telling Others About Your Research20 Questions
Exam 6: Psychology As a Science: What Is Science19 Questions
Exam 7: Accessing Difficult to Access Information20 Questions
Exam 8: Quasi-Experimental Designs Including Obervational Methods20 Questions
Exam 9: Experimental Design20 Questions
Exam 10: Interviewing and Focus Groups20 Questions
Exam 11: Descriptive Statistics: Graphical and Numerical Methods20 Questions
Exam 12: Content Analysis, Thematic Analysis and Discourse Analysis20 Questions
Exam 13: Self-Report Data20 Questions
Exam 14: Questionnaire Design20 Questions
Exam 15: Surveys and Sampling20 Questions
Exam 16: Inferential Statistics20 Questions
Exam 17: Factorial Anova20 Questions
Exam 18: Correlation and Regression20 Questions
Exam 19: Creating Latent Variables20 Questions
Select questions type
Then I used the same data to do a regression. I predicted height in centimeters, using height in inches as the predictor. What would I be most likely to find:
Free
(Multiple Choice)
4.7/5  (34)
(34)
Correct Answer: Verified
D
A researcher looks at the relationship between the scores for reading and age (in years) , for children in primary (elementary) school. The reading has 20 questions, so a score between 0 and 20 is possible. They find that the intercept = -5 and the slope = 2. What should they conclude?
Free
(Multiple Choice)
4.8/5 (40)
Correct Answer:Verified
A
Which of the following is true:
Free
(Multiple Choice)
4.8/5 (32)
Correct Answer:Verified
B
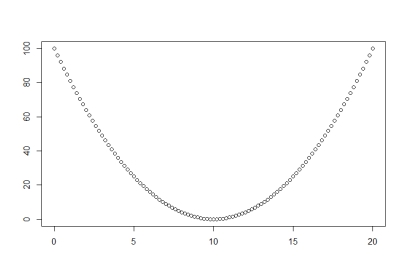
What (approximate) correlation is shown in the following scatterplot:
(Multiple Choice)
4.9/5 (44)
I asked students to measure their heights in inches, and then their heights in centimeters. I recorded the two measures and calculated the correlation between them. What do you think I would be most likely to find?
(Multiple Choice)
4.8/5 (35)
A researcher finds that orchestra conductors tend to die at an older age than other members of the orchestra. What can they conclude?
(Multiple Choice)
4.9/5 (30)
A researcher wants to examine the relationship between students' height, and the size of a box that they can jump over. Unfortunately, some of the students can't jump over the smallest box. This is an example of:
(Multiple Choice)
4.9/5 (37)
Which of the following sets of values could occur with a real dataset:
(Multiple Choice)
4.8/5 (27)
Regression analysis, rather than correlation might be used when:
(Multiple Choice)
4.7/5 (26)
Using Cohen's criteria, we would describe a correlation of 0.1 as:
(Multiple Choice)
5.0/5 (36)
If we find a negative relationship between owning a cat and being a victim of a burglar (such that people who have cats are less likely to have their possessions stolen), what can we conclude:
(Multiple Choice)
4.8/5 (34)
Using Cohen's criteria we would describe a correlation of r = 0.48 as:
(Multiple Choice)
4.7/5 (33)
A standardized regression line (in a bivariate regression) is:
(Multiple Choice)
5.0/5 (29)
A researcher assesses the smoking and drinking habits of a group of retired ex-coal miners, and also assesses their grip strength. The researcher finds that the miners who smoke and drink more have higher strength. What can they conclude:
(Multiple Choice)
4.8/5 (33)
Two researchers look at the relationship between the number of visits to the doctor with flu, and the temperature in different cities. They use the same data, but one researcher uses the Fahrenheit scale of temperature, and one uses the Celsius (centigrade scale). What would you expect:
(Multiple Choice)
4.9/5 (40)
Ladislaus Bortkiewicz famously looked at the number of Prussian soldiers who had been kicked to death by horses over about 200 years. He found a distribution that looked like this:
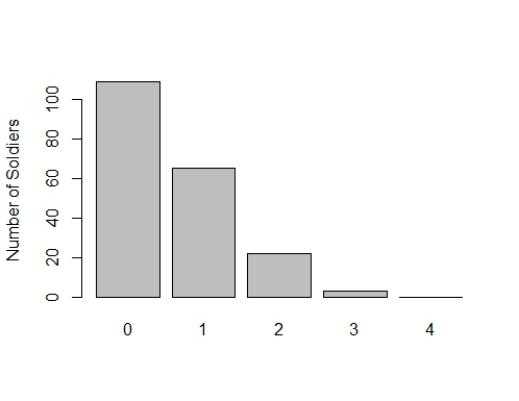 In most years (109) no Prussian soldiers were killed by horses. In 65 years, only one soldier died this way, until in one particularly bad year, 4 Prussian soldiers were killed by horses. If you wanted to predict this variable, what would you use?
(Multiple Choice)
5.0/5 (31)
You should use a Spearman correlation, rather than a Pearson correlation, if:
(Multiple Choice)
4.7/5 (38)
Filters
- Essay(0)
- Multiple Choice(0)
- Short Answer(0)
- True False(0)
- Matching(0)