Exam 32: The Fed Model: Linking Interest Rates, Output, and Inflation
Exam 1: The Core Principles of Economics156 Questions
Exam 2: Demand: Thinking Like a Buyer165 Questions
Exam 3: Supply: Thinking Like a Seller168 Questions
Exam 4: Equilibrium: Where Supply Meets Demand191 Questions
Exam 5: Elasticity: Measuring Responsiveness182 Questions
Exam 6: When Governments Intervene in Markets265 Questions
Exam 7: Welfare and Efficiency208 Questions
Exam 8: Gains From Trade161 Questions
Exam 9: International Trade215 Questions
Exam 10: Externalities and Public Goods241 Questions
Exam 11: Labor Demand and Supply223 Questions
Exam 12: Wages, Workers, and Management154 Questions
Exam 13: Inequality, Social Insurance, and Redistribution190 Questions
Exam 14: Market Structure and Market Power216 Questions
Exam 15: Entry, Exit, and Long-Run Profitability217 Questions
Exam 16: Business Strategy148 Questions
Exam 17: Sophisticated Pricing Strategies170 Questions
Exam 18: Game Theory and Strategic Choices227 Questions
Exam 19: Decisions Involving Uncertainty201 Questions
Exam 20: Decisions With Private Information156 Questions
Exam 21: Sizing up the Economy Using Gdp204 Questions
Exam 22: Economic Growth137 Questions
Exam 23: Unemployment167 Questions
Exam 24: Inflation and Money158 Questions
Exam 25: Consumption and Saving158 Questions
Exam 26: Investment150 Questions
Exam 27: The Financial Sector137 Questions
Exam 28: International Finance and the Exchange Rate129 Questions
Exam 29: Business Cycles149 Questions
Exam 30: IS-MP Analysis: Interest Rates and Output123 Questions
Exam 31: Phillips Curve131 Questions
Exam 32: The Fed Model: Linking Interest Rates, Output, and Inflation125 Questions
Exam 33: Aggregate Demand and Aggregate Supply169 Questions
Exam 34: Monetary Policy130 Questions
Exam 35: Government Spending, Taxes, and Fiscal Policy178 Questions
Exam 36: Appendix: Aggregate Expenditure and the Multiplier78 Questions
Select questions type
Which of the following graphs correctly represents a positive supply shock on the Phillips curve?
(Multiple Choice)
4.8/5  (44)
(44)
In the IS-MP analysis in the Fed model, the risk-free rate rises in response to:
(Multiple Choice)
4.8/5 (31)
If you see a newspaper headline that says "Banks shut doors - depositors scrambling to get their money back," this is an example of _____ shock.
(Multiple Choice)
4.9/5 (40)
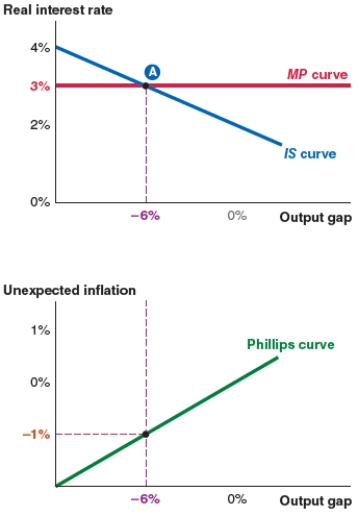
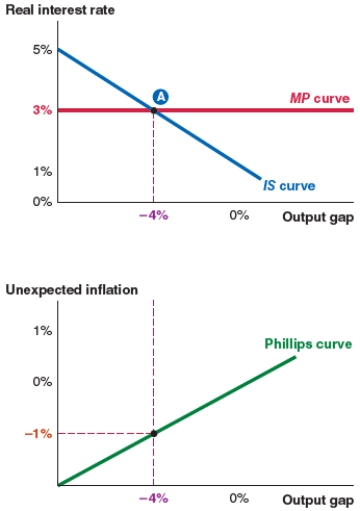
Take a look at the IS-MP-PC model shown here. If the expected inflation rate is 2.5%, the actual inflation rate is:

(Multiple Choice)
4.9/5 (37)
Assume that the economy starts at a 0% output gap. Now suppose that manufacturers in China face rising costs of rubber as an input. Based on this scenario, the Chinese economy experiences:
Figure A
Figure B
Figure B
Figure C
Figure C
Figure D
Figure D
(Multiple Choice)
4.8/5 (42)
Take a look at the IS-MP-PC model shown here. The equilibrium real interest rate is:

(Multiple Choice)
4.9/5 (39)
Holding everything else equal, India begins to import more processed food. Analyze this shock graphically, and explain using the Fed model.
(Essay)
4.8/5 (37)
Take a look at the IS-MP-PC model shown here. If the expected inflation rate is 1.75%, the actual inflation rate is:
(Multiple Choice)
4.8/5 (30)
Which of the following graphs correctly represents the effect on the Phillips curve in Ethiopia if the Ethiopian birr appreciates?
(Multiple Choice)
4.8/5 (37)
Suppose liquidity risk decreases. Analyze this shock graphically, and explain using the Fed model.
(Essay)
4.8/5 (39)
Take a look at the IS-MP-PC model shown here. At equilibrium, unexpected inflation is:
(Multiple Choice)
4.9/5 (38)
What are the steps for forecasting an economic outcome when there is a macroeconomic shock?
(Essay)
4.8/5 (35)
You are an economic adviser using the Fed model to analyze the economy. Now suppose that manufacturers in China face rising costs of rubber as an input. What is the effect on the economy?
(Multiple Choice)
4.7/5 (36)
When using the Fed model to diagnose the economy, if a shock causes the real interest rate to rise, then the economy has been hit by _____ shock.
(Multiple Choice)
4.9/5 (34)
Suppose that Banco de Mexico (Mexico's central bank) lowers real interest rates. Analyze this shock graphically, and explain using the Fed model.
(Essay)
4.9/5 (39)
In the IS-MP analysis in the Fed model, a decrease in the risk premium shifts the:
(Multiple Choice)
4.8/5 (32)
When a supply shock causes higher inflation but also causes output to fall, then the economy experiences:
(Multiple Choice)
4.8/5 (47)
You are an economic detective. Using the three clues provided, explain what kind of shock the economy most likely experienced. Further explain what curve in the Fed model was affected and in which direction the curve shifted.
- The real interest rate and output gap remain unchanged.
- The economy is in a recession.
- Actual inflation has increased.
(Essay)
4.8/5 (31)
Assume that a positive spending shock of $35 million hits the economy. If the multiplier is 4, by how much will the IS curve shift and in what direction?
(Essay)
4.8/5 (40)
Filters
- Essay(0)
- Multiple Choice(0)
- Short Answer(0)
- True False(0)
- Matching(0)