Exam 32: The Fed Model: Linking Interest Rates, Output, and Inflation
Exam 1: The Core Principles of Economics156 Questions
Exam 2: Demand: Thinking Like a Buyer165 Questions
Exam 3: Supply: Thinking Like a Seller168 Questions
Exam 4: Equilibrium: Where Supply Meets Demand191 Questions
Exam 5: Elasticity: Measuring Responsiveness182 Questions
Exam 6: When Governments Intervene in Markets265 Questions
Exam 7: Welfare and Efficiency208 Questions
Exam 8: Gains From Trade161 Questions
Exam 9: International Trade215 Questions
Exam 10: Externalities and Public Goods241 Questions
Exam 11: Labor Demand and Supply223 Questions
Exam 12: Wages, Workers, and Management154 Questions
Exam 13: Inequality, Social Insurance, and Redistribution190 Questions
Exam 14: Market Structure and Market Power216 Questions
Exam 15: Entry, Exit, and Long-Run Profitability217 Questions
Exam 16: Business Strategy148 Questions
Exam 17: Sophisticated Pricing Strategies170 Questions
Exam 18: Game Theory and Strategic Choices227 Questions
Exam 19: Decisions Involving Uncertainty201 Questions
Exam 20: Decisions With Private Information156 Questions
Exam 21: Sizing up the Economy Using Gdp204 Questions
Exam 22: Economic Growth137 Questions
Exam 23: Unemployment167 Questions
Exam 24: Inflation and Money158 Questions
Exam 25: Consumption and Saving158 Questions
Exam 26: Investment150 Questions
Exam 27: The Financial Sector137 Questions
Exam 28: International Finance and the Exchange Rate129 Questions
Exam 29: Business Cycles149 Questions
Exam 30: IS-MP Analysis: Interest Rates and Output123 Questions
Exam 31: Phillips Curve131 Questions
Exam 32: The Fed Model: Linking Interest Rates, Output, and Inflation125 Questions
Exam 33: Aggregate Demand and Aggregate Supply169 Questions
Exam 34: Monetary Policy130 Questions
Exam 35: Government Spending, Taxes, and Fiscal Policy178 Questions
Exam 36: Appendix: Aggregate Expenditure and the Multiplier78 Questions
Select questions type
In the IS-MP analysis in the Fed model, the MP curve shows you the:
(Multiple Choice)
4.9/5  (38)
(38)
Explain the following concepts:
(a) financial shock
(b) spending shock
(c) supply shock
(Essay)
4.8/5 (35)
In the IS-MP analysis in the Fed model, a decrease in exports will shift the:
(Multiple Choice)
4.8/5 (28)
Suppose nominal wages fall in Bangladesh. Analyze this shock graphically, and explain using the Fed model.
(Essay)
4.8/5 (37)
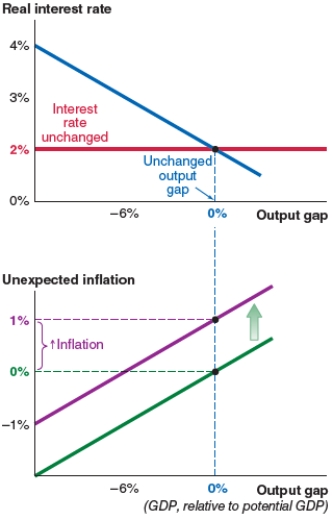
The economy shown here begins at a 0% output gap. Now suppose that consumers fear a recession and reduce their spending. This leads to:

(Multiple Choice)
4.8/5 (36)
The framework that the Federal Reserve uses to analyze, forecast, and adjust the economy is called:
(Multiple Choice)
4.9/5 (31)
Which of the following graphs correctly represents an increase in the risk premium on the MP curve?
(Multiple Choice)
4.9/5 (42)
If the default risk rises in Greece, which of the following graphs correctly represents the effect on the MP curve in Greece?
(Multiple Choice)
4.9/5 (40)
Assume that the economy starts at a 0% output gap. Now suppose that consumers fear a recession and reduce their spending. Based on this scenario, the economy experiences:
Figure A
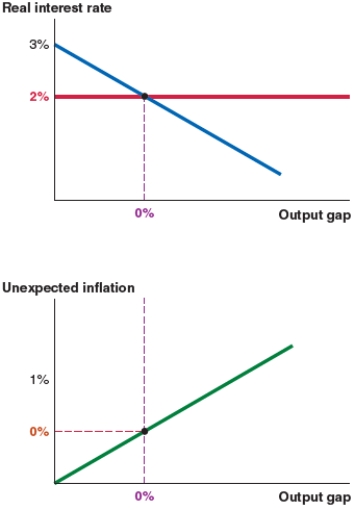
Figure B
Figure B
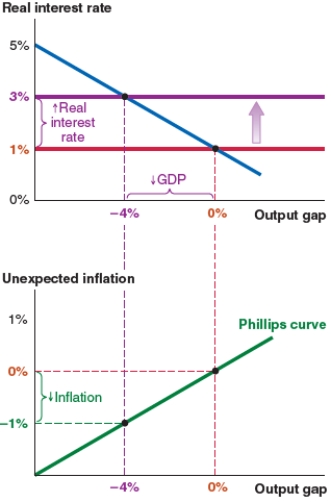
Figure C
Figure C
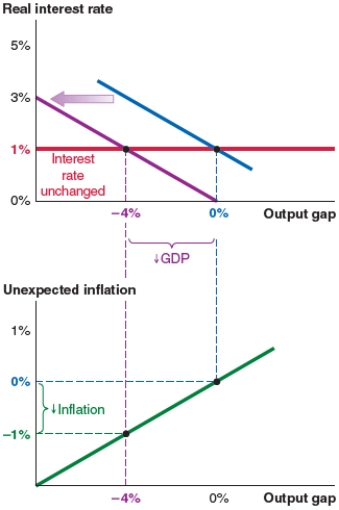
Figure D
Figure D
(Multiple Choice)
4.8/5 (35)
If you see a newspaper headline that says "Consumer confidence falls as stock market plummets 1,500 points," this is an example of _____ shock.
(Multiple Choice)
4.7/5 (41)
Which of the following graphs correctly represents a negative spending shock on the IS curve?
(Multiple Choice)
4.8/5 (37)
Suppose there is a financial upheaval, which leads banks to hold on to deposits and stem the flow of loans. Analyze this shock graphically, and explain using the Fed model.
(Essay)
4.7/5 (38)
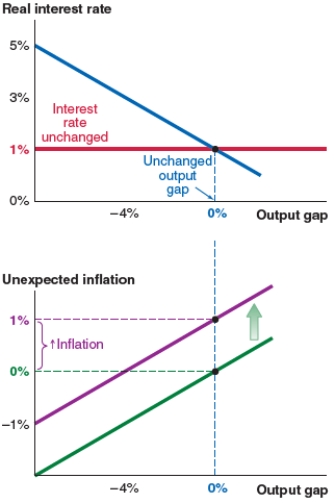
The economy shown here begins at a 0% output gap. Now suppose that consumers fear a recession and reduce their spending. If inflation expectations remain unchanged, the actual inflation rate will be:

(Multiple Choice)
4.8/5 (37)
Take a look at the IS-MP-PC model shown here. At equilibrium, the output gap is:
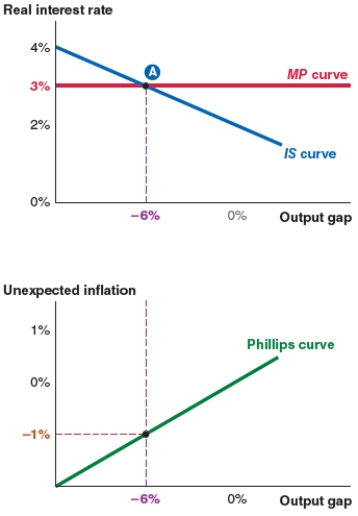
(Multiple Choice)
5.0/5 (31)
In the IS-MP analysis in the Fed model, a fall in government expenditure will shift the:
(Multiple Choice)
4.7/5 (44)
In the IS-MP analysis in the Fed model, a rise in government expenditure will shift the:
(Multiple Choice)
4.9/5 (44)
In the IS-MP analysis in the Fed model, the intersection of the IS and MP curves determines the:
(Multiple Choice)
4.7/5 (28)
The economy shown here begins at a 0% output gap. Now suppose that manufacturers in China face rising costs of rubber as an input. This leads to:
(Multiple Choice)
4.8/5 (39)
Which of the following graphs correctly represents the effect on the MP curve if lenders become less risk averse?
(Multiple Choice)
4.9/5 (30)
Filters
- Essay(0)
- Multiple Choice(0)
- Short Answer(0)
- True False(0)
- Matching(0)