Exam 32: The Fed Model: Linking Interest Rates, Output, and Inflation
Exam 1: The Core Principles of Economics156 Questions
Exam 2: Demand: Thinking Like a Buyer165 Questions
Exam 3: Supply: Thinking Like a Seller168 Questions
Exam 4: Equilibrium: Where Supply Meets Demand191 Questions
Exam 5: Elasticity: Measuring Responsiveness182 Questions
Exam 6: When Governments Intervene in Markets265 Questions
Exam 7: Welfare and Efficiency208 Questions
Exam 8: Gains From Trade161 Questions
Exam 9: International Trade215 Questions
Exam 10: Externalities and Public Goods241 Questions
Exam 11: Labor Demand and Supply223 Questions
Exam 12: Wages, Workers, and Management154 Questions
Exam 13: Inequality, Social Insurance, and Redistribution190 Questions
Exam 14: Market Structure and Market Power216 Questions
Exam 15: Entry, Exit, and Long-Run Profitability217 Questions
Exam 16: Business Strategy148 Questions
Exam 17: Sophisticated Pricing Strategies170 Questions
Exam 18: Game Theory and Strategic Choices227 Questions
Exam 19: Decisions Involving Uncertainty201 Questions
Exam 20: Decisions With Private Information156 Questions
Exam 21: Sizing up the Economy Using Gdp204 Questions
Exam 22: Economic Growth137 Questions
Exam 23: Unemployment167 Questions
Exam 24: Inflation and Money158 Questions
Exam 25: Consumption and Saving158 Questions
Exam 26: Investment150 Questions
Exam 27: The Financial Sector137 Questions
Exam 28: International Finance and the Exchange Rate129 Questions
Exam 29: Business Cycles149 Questions
Exam 30: IS-MP Analysis: Interest Rates and Output123 Questions
Exam 31: Phillips Curve131 Questions
Exam 32: The Fed Model: Linking Interest Rates, Output, and Inflation125 Questions
Exam 33: Aggregate Demand and Aggregate Supply169 Questions
Exam 34: Monetary Policy130 Questions
Exam 35: Government Spending, Taxes, and Fiscal Policy178 Questions
Exam 36: Appendix: Aggregate Expenditure and the Multiplier78 Questions
Select questions type
In the IS-MP analysis in the Fed model, an increase in net exports will shift the:
(Multiple Choice)
4.9/5  (42)
(42)
If a spending shock increases aggregate expenditure by $35 billion and the multiplier is 2.5, then the IS curve will shift:
(Multiple Choice)
4.8/5 (33)
If you see a newspaper headline that says "U.S. exports plunge," this is an example of _____ shock.
(Multiple Choice)
4.9/5 (35)
Which of the following graphs correctly represents a negative supply shock on the Phillips curve?
(Multiple Choice)
4.9/5 (40)
Suppose net exports fall in South Africa. Analyze this shock graphically, and explain using the Fed model.
(Essay)
4.9/5 (35)
If you see a newspaper headline that says "Oil prices rise sharply," this is an example of _____ shock.
(Multiple Choice)
4.9/5 (39)
If a spending shock reduces aggregate expenditure by $600 million and the multiplier is 2.5, then the IS curve will shift:
(Multiple Choice)
5.0/5 (43)
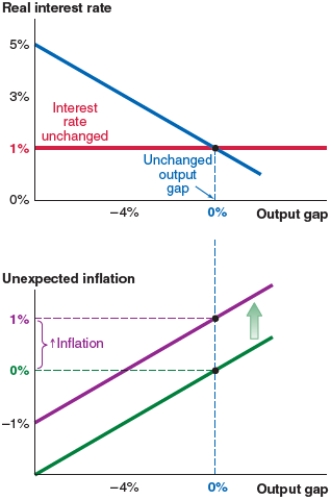
Take a look at the IS-MP-PC model shown here. At equilibrium, the output gap is:
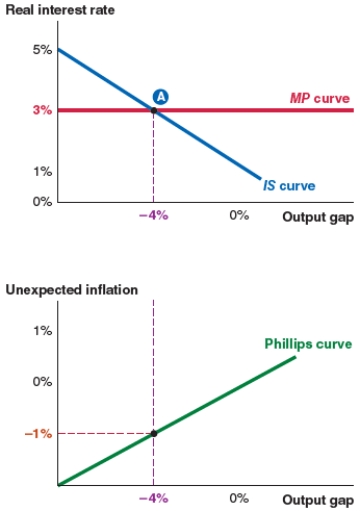
(Multiple Choice)
4.9/5 (40)
If the real interest rate rises in the economy, what kind of shock does the economy experience? Which curve in the Fed model is affected, and in which direction does the curve shift?
(Essay)
4.9/5 (36)
In the IS-MP analysis in the Fed model, if the Federal Reserve raises the federal funds rate, the:
(Multiple Choice)
4.9/5 (46)
In the IS-MP analysis in the Fed model, an increase in imports will shift the:
(Multiple Choice)
4.8/5 (36)
In 2017, nearly 3.5% of Vietnamese imports constituted of refined oil. If the price of oil rises significantly, what effect does this have on the Phillips curve in Vietnam?
(Multiple Choice)
4.7/5 (48)
In the IS-MP analysis in the Fed model, a fall in the interest rate causes a:
(Multiple Choice)
4.9/5 (37)
Assume that the economy starts at a 0% output gap. Now suppose that banks begin to fear the risk of default and the risk premium rises by 2%. Which of the following figures shows what happens in this scenario?
Figure A
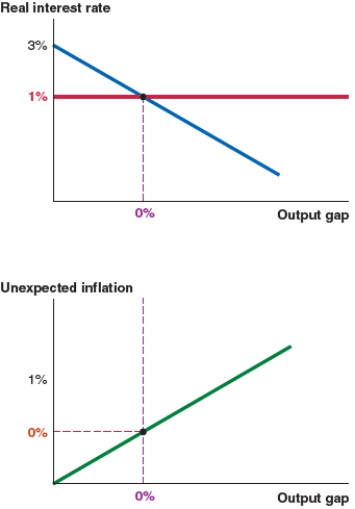
Figure B
Figure B
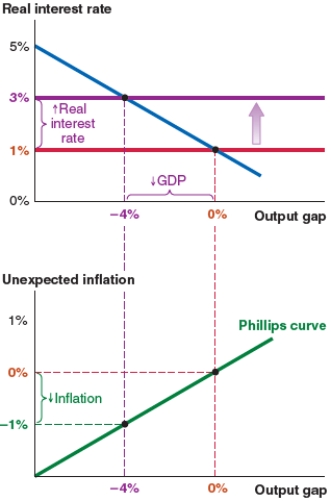
Figure C
Figure C
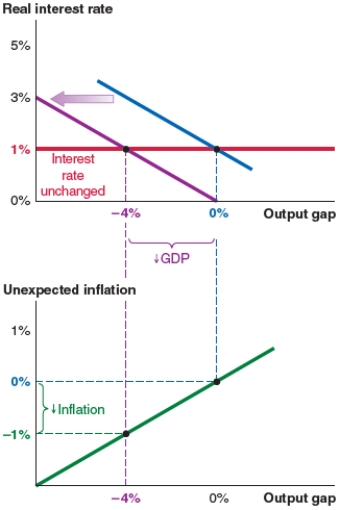
Figure D
Figure D
(Multiple Choice)
4.9/5 (37)
If a spending shock increases aggregate expenditure by $75 million and the multiplier is 3, then the IS curve will shift:
(Multiple Choice)
4.9/5 (39)
The Fed model links the IS, MP, and Phillips curves. In the IS-MP analysis, an increase in exports will shift the:
(Multiple Choice)
4.8/5 (38)
Suppose the government increases taxes on corporations. Analyze this shock graphically, and explain using the Fed model.
(Essay)
4.9/5 (41)
Which of the following graphs correctly represents the effect on the MP curve if there is a rise in liquidity risk in the United States?
(Multiple Choice)
4.9/5 (36)
Take a look at the IS-MP-PC model shown here. If the expected inflation rate is 2%, the actual inflation rate is:

(Multiple Choice)
4.9/5 (36)
Filters
- Essay(0)
- Multiple Choice(0)
- Short Answer(0)
- True False(0)
- Matching(0)