Exam 32: The Fed Model: Linking Interest Rates, Output, and Inflation
Exam 1: The Core Principles of Economics156 Questions
Exam 2: Demand: Thinking Like a Buyer165 Questions
Exam 3: Supply: Thinking Like a Seller168 Questions
Exam 4: Equilibrium: Where Supply Meets Demand191 Questions
Exam 5: Elasticity: Measuring Responsiveness182 Questions
Exam 6: When Governments Intervene in Markets265 Questions
Exam 7: Welfare and Efficiency208 Questions
Exam 8: Gains From Trade161 Questions
Exam 9: International Trade215 Questions
Exam 10: Externalities and Public Goods241 Questions
Exam 11: Labor Demand and Supply223 Questions
Exam 12: Wages, Workers, and Management154 Questions
Exam 13: Inequality, Social Insurance, and Redistribution190 Questions
Exam 14: Market Structure and Market Power216 Questions
Exam 15: Entry, Exit, and Long-Run Profitability217 Questions
Exam 16: Business Strategy148 Questions
Exam 17: Sophisticated Pricing Strategies170 Questions
Exam 18: Game Theory and Strategic Choices227 Questions
Exam 19: Decisions Involving Uncertainty201 Questions
Exam 20: Decisions With Private Information156 Questions
Exam 21: Sizing up the Economy Using Gdp204 Questions
Exam 22: Economic Growth137 Questions
Exam 23: Unemployment167 Questions
Exam 24: Inflation and Money158 Questions
Exam 25: Consumption and Saving158 Questions
Exam 26: Investment150 Questions
Exam 27: The Financial Sector137 Questions
Exam 28: International Finance and the Exchange Rate129 Questions
Exam 29: Business Cycles149 Questions
Exam 30: IS-MP Analysis: Interest Rates and Output123 Questions
Exam 31: Phillips Curve131 Questions
Exam 32: The Fed Model: Linking Interest Rates, Output, and Inflation125 Questions
Exam 33: Aggregate Demand and Aggregate Supply169 Questions
Exam 34: Monetary Policy130 Questions
Exam 35: Government Spending, Taxes, and Fiscal Policy178 Questions
Exam 36: Appendix: Aggregate Expenditure and the Multiplier78 Questions
Select questions type
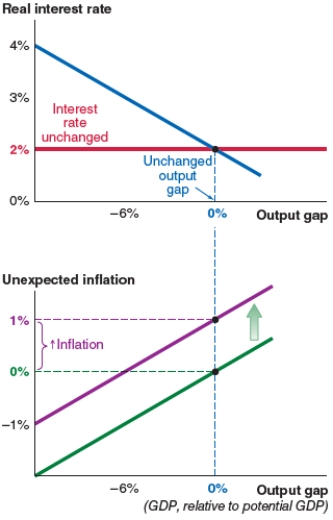
The economy shown here begins at a 0% output gap. Now suppose that manufacturers in China face rising costs of rubber as an input. This leads to:
(Multiple Choice)
4.9/5  (44)
(44)
The 1973 OPEC oil embargo is an example of a negative _____ shock to the U.S. economy.
(Multiple Choice)
4.7/5 (37)
Take a look at the IS-MP-PC model shown here. If a spending shock causes the IS curve to shift right until the output gap is 0%, what will the new equilibrium real interest rate be?
(Multiple Choice)
4.8/5 (38)
If the Canadian dollar depreciates, which of the following graphs correctly represents the effect on the IS curve in Canada?
(Multiple Choice)
4.8/5 (49)
The Fed model combines the _____ curve, the _____ curve, and the ____ curve to link interest rates, the output gap, and inflation.
(Multiple Choice)
4.8/5 (32)
You are an economic adviser using the Fed model to analyze the economy. What is the effect of a rise in the risk premium in the economy?
(Multiple Choice)
4.9/5 (29)
In the IS-MP analysis in the Fed model, a decrease in net exports will shift the:
(Multiple Choice)
4.8/5 (35)
If the government lowers corporate taxes, which of the following graphs correctly represents the effect on the IS curve?
(Multiple Choice)
4.7/5 (36)
Consumers receive more disposable income. Analyze this shock graphically, and explain using the Fed model.
(Essay)
4.9/5 (36)
The economy shown here begins at a 0% output gap. Now suppose that manufacturers in China face rising costs of rubber as an input. This leads to:

(Multiple Choice)
4.8/5 (39)
Once you have identified the point of equilibrium in the IS-MP graph in the Fed model, the vertical axis will show you the:
(Multiple Choice)
4.9/5 (39)
If a spending shock reduces aggregate expenditure by $40 billion and the multiplier is 2, then the IS curve will shift:
(Multiple Choice)
4.7/5 (33)
In the IS-MP analysis in the Fed model, a rise in the risk-free rate shifts the:
(Multiple Choice)
4.7/5 (32)
Classify the following as a financial shock, a spending shock, or a supply shock.
(a) The U.S. dollar depreciates.
(b) Tariffs raise the price of steel.
(c) The stock market booms.
(d) Liquidity risk increases.
(Essay)
4.7/5 (40)
In the IS-MP analysis in the Fed model, a rise in the interest rate causes a:
(Multiple Choice)
4.9/5 (34)
Which of the following graphs correctly represents the effect on the Phillips curve if there is widespread production technology improvement in Bangladesh?
(Multiple Choice)
4.9/5 (34)
In the IS-MP analysis in the Fed model, a fall in investment will shift the:
(Multiple Choice)
4.8/5 (33)
When using the Fed model to diagnose the economy, if inflation rises even though the economy is weak or if it falls even though the economy is strong, then the economy has been hit by _____ shock.
(Multiple Choice)
4.8/5 (34)
Filters
- Essay(0)
- Multiple Choice(0)
- Short Answer(0)
- True False(0)
- Matching(0)