Exam 2: Exploring Data: Frequency Distributions and Graphs
Exam 1: Introduction211 Questions
Exam 2: Exploring Data: Frequency Distributions and Graphs94 Questions
Exam 3: Exploring Data: Central Tendency103 Questions
Exam 4: Exploring Data: Variability137 Questions
Exam 5: Other Descriptive Statistics188 Questions
Exam 6: Correlation and Regression170 Questions
Exam 7: Theoretical Distributions Including the Normal Distribution138 Questions
Exam 8: Samples, Sampling Distributions, and Confidence Intervals162 Questions
Exam 9: Hypothesis Testing and Effect Size: One-Sample Designs157 Questions
Exam 10: Hypothesis Testing, Effect Size, and and Confidence Intervals: Two-Sample Designs206 Questions
Exam 11: Analysis of Variance: One-Way Classification176 Questions
Exam 12: Analysis of Variance: One-Factor Repeated Measures105 Questions
Exam 13: Analysis of Variance: Factorial Design148 Questions
Exam 14: Chi Square Tests147 Questions
Exam 15: More Nonparametric Tests150 Questions
Exam 16: Appendix: Grouped Frequency Distributions and Central Tendency21 Questions
Select questions type
The frequency distribution scores ranged from 0 to 100. Low scores were infrequent, there were a moderate number around 50, and near 100 scores were quite frequent. The distribution is
(Multiple Choice)
4.9/5  (31)
(31)
Identify the skew of each distribution below.
- X f 14 21 13 20 12 13 11 8 10 3 0 1
(Multiple Choice)
4.8/5 (42)
Suppose a frequency distribution with a range of 0 to 100 was positively skewed. The greatest frequency of scores would be expected around
(Multiple Choice)
4.8/5 (38)
The graph that is used to present data on two variables rather than one is the
(Multiple Choice)
5.0/5 (38)
Your text shows a template that gives the proportions for the X and Y axis that is "almost guaranteed to produce a pleasant-looking graph."
(True/False)
4.9/5 (40)
Data Set 2-3 The graph in Data Set 2-3 is based on registration figures by the American Kennel Club.
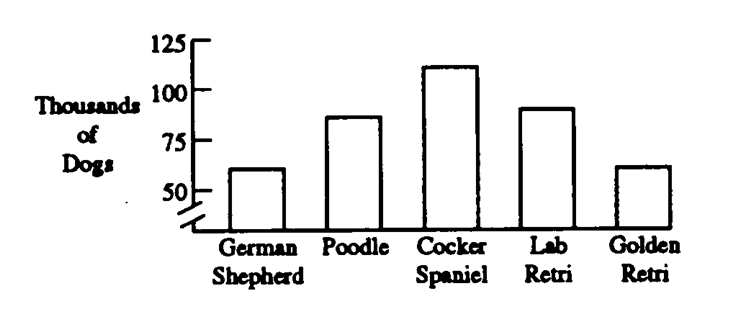 -The proper name for the graph in Data Set 2-3 is
(Multiple Choice)
4.9/5 (43)
Identify the skew of the two distributions below.
- X f 103 3 102 3 101 18 100 10 99 8 98 3 97 2 96 1 95 1
(Multiple Choice)
4.9/5 (39)
Describe what the following graphs are used for.
a. line graph
b. frequency polygon
c. histogram
d. bar graph
(Essay)
4.8/5 (37)
A rough-draft grouped frequency distribution is characterized by
(Multiple Choice)
4.8/5 (30)
Describe each graph below as correct or incorrect. Tell what is wrong with the incorrect one(s).
-
(Multiple Choice)
4.9/5 (39)
Identify the skew of each distribution below.
- X f 127 1 126 2 125 9 124 5 123 4 122 3 121 1
(Multiple Choice)
4.9/5 (39)
Identify each graph below as correct or incorrect. Describe what is wrong with each incorrect one.
-
(Multiple Choice)
4.9/5 (40)
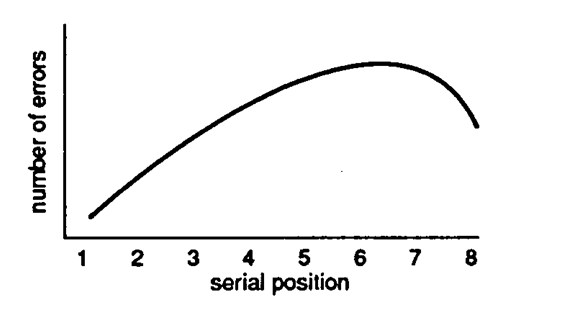
To show the relationship between serial position of words on a list and errors, the proper graph is a line graph.
(True/False)
4.8/5 (41)
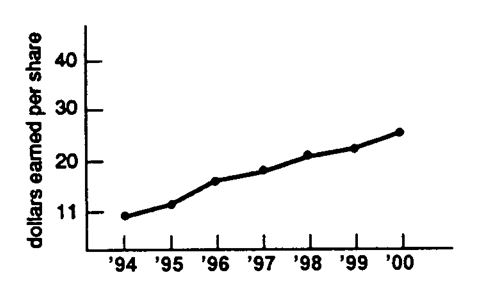
To graph the relationship between age and auditory sensitivity, use a
(Multiple Choice)
4.8/5 (41)
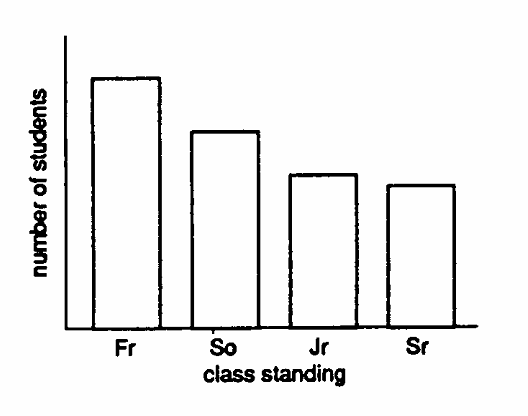
Describe each figure below as a frequency polygon, histogram, or line graph.
-
(Multiple Choice)
4.8/5 (42)
Filters
- Essay(0)
- Multiple Choice(0)
- Short Answer(0)
- True False(0)
- Matching(0)