Exam 2: Exploring Data: Frequency Distributions and Graphs
Exam 1: Introduction211 Questions
Exam 2: Exploring Data: Frequency Distributions and Graphs94 Questions
Exam 3: Exploring Data: Central Tendency103 Questions
Exam 4: Exploring Data: Variability137 Questions
Exam 5: Other Descriptive Statistics188 Questions
Exam 6: Correlation and Regression170 Questions
Exam 7: Theoretical Distributions Including the Normal Distribution138 Questions
Exam 8: Samples, Sampling Distributions, and Confidence Intervals162 Questions
Exam 9: Hypothesis Testing and Effect Size: One-Sample Designs157 Questions
Exam 10: Hypothesis Testing, Effect Size, and and Confidence Intervals: Two-Sample Designs206 Questions
Exam 11: Analysis of Variance: One-Way Classification176 Questions
Exam 12: Analysis of Variance: One-Factor Repeated Measures105 Questions
Exam 13: Analysis of Variance: Factorial Design148 Questions
Exam 14: Chi Square Tests147 Questions
Exam 15: More Nonparametric Tests150 Questions
Exam 16: Appendix: Grouped Frequency Distributions and Central Tendency21 Questions
Select questions type
College students listed all the states in the USA that they could recall. The number each recalled is shown below. Arrange the counts into an appropriate frequency distribution, tell the direction of skew, if any, and construct a graph of the distribution. Use the class intervals that begin with 45 - 47 and end with 9 - 11. 18 34 25 32 18 40 12 38 26 40 23 29 38 23 26 42 21 9 35 25 17 15 25 37 24 12 45 28 13 22 16 28 32 25 41 27 19 24 18 16 46 28 39 11 25 45 20 29 33 21
(Essay)
4.8/5  (39)
(39)
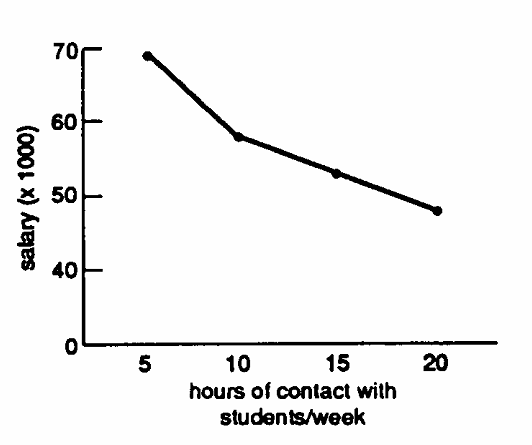
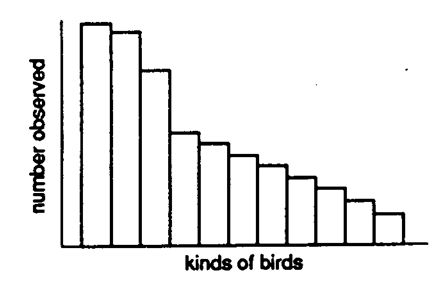
Describe each figure below as a frequency polygon, histogram, or line graph.
-
(Multiple Choice)
4.9/5 (35)
Horizontal axis, X-axis, and abscissa are all names for the same line.
(True/False)
4.9/5 (44)
Vertical axis, Y-axis, and abscissa are all names for the same line.
(True/False)
4.8/5 (33)
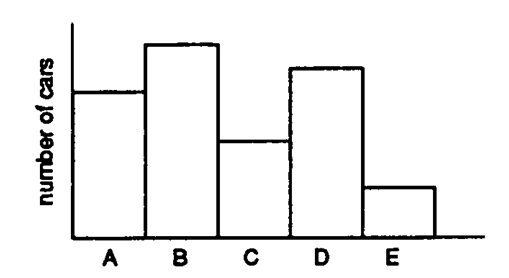
Identify each graph below as correct or incorrect. Describe what is wrong with each incorrect one.
-
(Multiple Choice)
4.8/5 (41)
Describe each graph below as correct or incorrect. Tell what is wrong with the incorrect one(s).
-
(Multiple Choice)
4.9/5 (35)
A negatively skewed curve has a thin point directed to the right side of a graph.
(True/False)
4.9/5 (38)
Line graphs are used more extensively in psychology textbooks and journal articles than frequency polygons.
(True/False)
4.9/5 (28)
The proper graph for the frequency distribution of college majors is a bar graph.
(True/False)
4.8/5 (40)
A bar graph is used to present the frequencies of a qualitative variable.
(True/False)
4.9/5 (28)
A histogram is used to present the frequencies of a qualitative variable.
(True/False)
4.8/5 (41)
When Buttercup and Wesley were in the Fire Swamp, they were attacked by the largest mammals not yet known to modern science. How big were they, you ask? Fortunately, your brave instructor captured and weighed 40 of these Rodents of Unusual Size. Arrange the weights (kilograms) into an appropriate frequency distribution. Class intervals should begin with 93-97 and end with 38-42. Identify the skew, if any. Graph the distribution. (FYI: the largest recognized rodents, the South American capybara, weigh 40 kg. Beaver, the second largest, average 13 kg. Big male rats are about half a kilogram.) 51 72 68 54 62 49 95 46 85 76 65 59 60 51 53 50 39 56 81 59 44 59 49 70 89 78 38 60 48 44 51 52 55 44 61 50 97 43 54 57
(Essay)
5.0/5 (39)
Which alternative has elements that are congruent (all belong together)?
(Multiple Choice)
4.9/5 (31)
Identify the skew of each distribution below.
- X f 8 6 7 14 6 27 5 61 4 58
(Multiple Choice)
4.7/5 (36)
Grouped frequency distributions and simple frequency distributions differ in
(Multiple Choice)
4.7/5 (39)
A histogram and a bar graph can be used for the same frequency distribution.
(True/False)
4.9/5 (29)
Tally marks are not part of a formal presentation of a simple frequency distribution.
(True/False)
4.8/5 (38)
Data Set 2-1
A student was interested in the structure of the families in the U.S. He sampled 29 of his 330 classmates and got the following answers to the question, "How many children are there in your family?"
3 , 1 , 2 , 2 , 4 , 2 , 1 , 2 , 2 , 1 , 3 , 2 , 3 , 3 , 4 , 2 , 2 , 1 , 3 , 5 , 1 , 1 , 3 , 5 , 2 , 4 , 7 , 1 , 2
-Referring to Data Set 2-1, the distribution of these scores is
(Multiple Choice)
4.7/5 (33)
Filters
- Essay(0)
- Multiple Choice(0)
- Short Answer(0)
- True False(0)
- Matching(0)