Exam 2: Exploring Data: Frequency Distributions and Graphs
Exam 1: Introduction211 Questions
Exam 2: Exploring Data: Frequency Distributions and Graphs94 Questions
Exam 3: Exploring Data: Central Tendency103 Questions
Exam 4: Exploring Data: Variability137 Questions
Exam 5: Other Descriptive Statistics188 Questions
Exam 6: Correlation and Regression170 Questions
Exam 7: Theoretical Distributions Including the Normal Distribution138 Questions
Exam 8: Samples, Sampling Distributions, and Confidence Intervals162 Questions
Exam 9: Hypothesis Testing and Effect Size: One-Sample Designs157 Questions
Exam 10: Hypothesis Testing, Effect Size, and and Confidence Intervals: Two-Sample Designs206 Questions
Exam 11: Analysis of Variance: One-Way Classification176 Questions
Exam 12: Analysis of Variance: One-Factor Repeated Measures105 Questions
Exam 13: Analysis of Variance: Factorial Design148 Questions
Exam 14: Chi Square Tests147 Questions
Exam 15: More Nonparametric Tests150 Questions
Exam 16: Appendix: Grouped Frequency Distributions and Central Tendency21 Questions
Select questions type
Your text says that the primary use of graphs is to show results to others.
(True/False)
4.8/5  (39)
(39)
A distribution shaped like a box is a_______________distribution; one that has two peaks is a ____________ distribution.
(Multiple Choice)
4.8/5 (47)
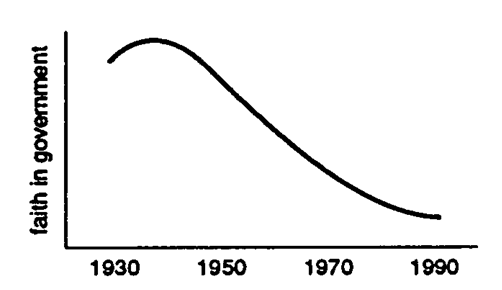
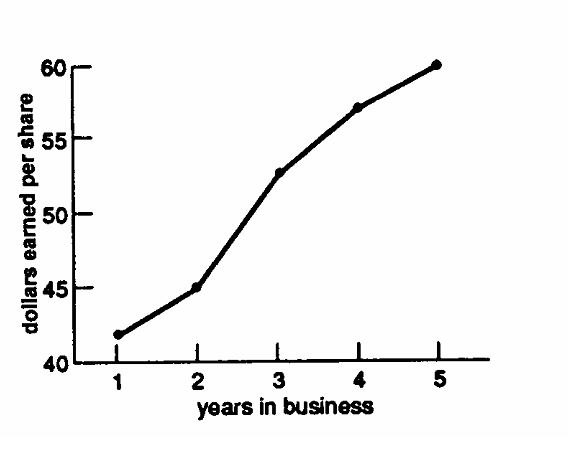
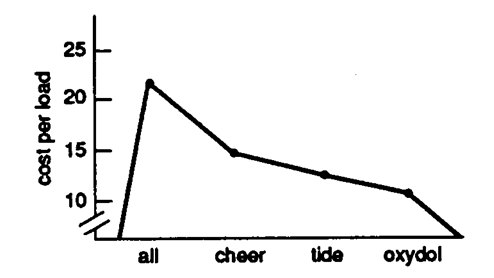
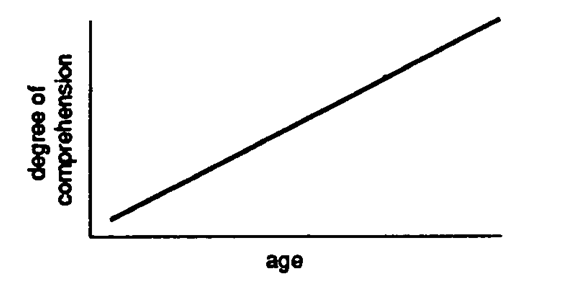
Describe each figure below as a frequency polygon, histogram, or line graph.
-
(Multiple Choice)
4.8/5 (37)
Identify each graph below as correct or incorrect. Describe what is wrong with each incorrect one.
-
(Multiple Choice)
4.8/5 (26)
Describe each graph below as correct or incorrect. Tell what is wrong with the incorrect one(s).
-
(Multiple Choice)
4.7/5 (32)
Bar graphs are used more extensively in psychology textbooks and journal articles than line graphs.
(True/False)
4.8/5 (28)
The serial position effect was displayed in the text with mean errors on the ordinate and serial position on the abscissa. This graphic is an example of a
(Multiple Choice)
4.9/5 (44)
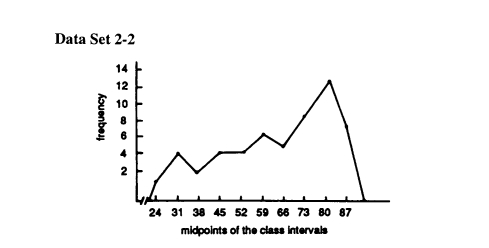 -Referring to Data Set 2-2, the number of scores in the interval 59 - 66 is
(Multiple Choice)
4.8/5 (32)
A group of American college students named as many of the 12 Canadian provinces and territories as they could. Arrange the scores into a simple frequency distribution. Draw a frequency polygon from the data. 8 , 6 , 5 , 5 , 10 , 7 , 7 , 4 , 3 , 5 , 3 , 6 , 8 , 6 , 8 , 5 , 6 , 5 , 4 , 4
(Essay)
4.7/5 (45)
The administration at Warmfuzzy University gave a 7-item questionnaire to a representative sample of seniors. Each item was a statement of intention (recommend WU to others, return after graduation, give money, and so forth). The seniors simply checked the items they intended to do. A person's score was the sum of the items checked. Arrange the scores into a simple frequency distribution. Construct a histogram. 1 2 1 3 0 4 0 5 1 2 4 0 5 0 1 3 0 1 3 6 1 2 1 2 4 7
(Essay)
4.8/5 (44)
A distribution with two separated peaks is a__________distribution; one that is normal is a ___________distribution.
(Multiple Choice)
4.9/5 (36)
Line graphs are used more extensively in psychology textbooks and journal articles than bar graphs.
(True/False)
4.8/5 (31)
Suppose a frequency distribution with a range of 0 to 100 was severely negatively skewed. The greatest frequency of scores would be clustered near
(Multiple Choice)
4.8/5 (39)
A line graph and a frequency polygon can be used interchangeably.
(True/False)
4.7/5 (42)
Suppose you had frequency counts of sparrows, starlings, swans, swallows, sandpipers, and sapsuckers. The appropriate graph for such data would be a
(Multiple Choice)
4.8/5 (39)
Describe each figure below as a frequency polygon, histogram, or line graph.
-
(Multiple Choice)
4.9/5 (35)
The horizontal axis of a graph of a frequency distribution is called
(Multiple Choice)
4.8/5 (30)
The serial position effect shows that when material is learned in order, the most difficult part
(Multiple Choice)
4.8/5 (44)
Data Set 2-3 The graph in Data Set 2-3 is based on registration figures by the American Kennel Club.
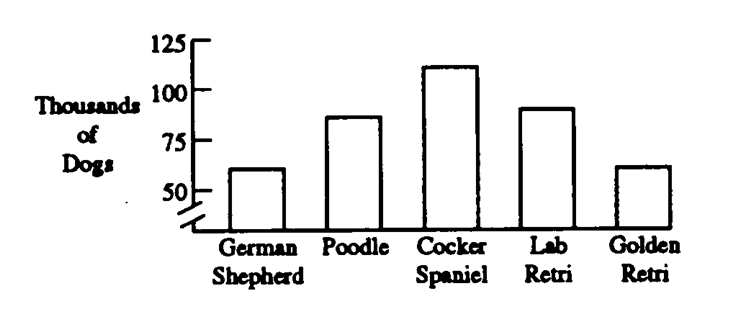 -Data Set 2-3
(Multiple Choice)
4.9/5 (38)
Filters
- Essay(0)
- Multiple Choice(0)
- Short Answer(0)
- True False(0)
- Matching(0)