Exam 21: The Theory of Consumer Choice
Exam 1: Ten Principles of Economics237 Questions
Exam 2: Thinking Like an Economist267 Questions
Exam 3: Interdependence and the Gains From Trade217 Questions
Exam 4: The Market Forces of Supply and Demand303 Questions
Exam 5: Elasticity and Its Applications282 Questions
Exam 6: Supply, demand, and Government Policies252 Questions
Exam 7: Consumers, producers, and the Efficiency of Markets248 Questions
Exam 8: Application: the Costs of Taxation245 Questions
Exam 9: Application: International Trade245 Questions
Exam 10: Externalities288 Questions
Exam 11: Public Goods and Common Resources258 Questions
Exam 12: The Design of the Tax System328 Questions
Exam 13: The Costs of Production303 Questions
Exam 14: Firms in Competitive Markets271 Questions
Exam 15: Monopoly306 Questions
Exam 16: Oligopoly291 Questions
Exam 17: Monopolistic Competition257 Questions
Exam 18: The Markets for the Factors of Production284 Questions
Exam 19: Earnings and Discrimination286 Questions
Exam 20: Income Inequality and Poverty247 Questions
Exam 21: The Theory of Consumer Choice238 Questions
Exam 22: Frontiers of Microeconomics199 Questions
Exam 23: Measuring a Nations Income215 Questions
Exam 24: Measuring the Cost of Living208 Questions
Exam 25: Production and Growth240 Questions
Exam 26: Saving, investment, and the Financial System282 Questions
Exam 27: The Basic Tools of Finance249 Questions
Exam 28: Unemployment242 Questions
Exam 29: The Monetary System277 Questions
Exam 30: Money Growth and Inflation224 Questions
Exam 31: Open-Economy Macroeconomics: Basic Concepts256 Questions
Exam 32: A Macroeconomic Theory of the Open Economy217 Questions
Exam 33: Aggregate Demand and Aggregate Supply302 Questions
Exam 34: The Influence of Monetary and Fiscal Policy on Aggregate Demand249 Questions
Exam 35: The Short Run Trade Off Between Inflation and Unemployment246 Questions
Exam 36: Five Debates Over Macroeconomic Policy140 Questions
Select questions type
When economists describe preferences,they often use the concept of
(Multiple Choice)
4.9/5  (37)
(37)
The theory of consumer choice provides the foundation for understanding
(Multiple Choice)
4.9/5 (40)
The slope at any point on an indifference curve equals the absolute price at which one consumer is willing to substitute one good for the other.
(True/False)
4.7/5 (41)
A rise in the interest rate will generally result in people consuming more when they are old.
(True/False)
4.9/5 (36)
Figure 21-8
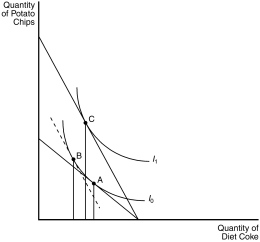 -Refer to Figure 21-8.The shift from point B to point C in the figure is due to the
(Multiple Choice)
4.8/5 (38)
Figure 21-9
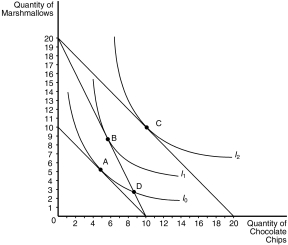 -Refer to Figure 21-9.Assume that the consumer depicted in the figure has an income of $40.Which of the following price-quantity combinations would be on her demand curve for marshmallows if the price of chocolate chips is $4?
(Multiple Choice)
4.9/5 (36)
Figure 21-3
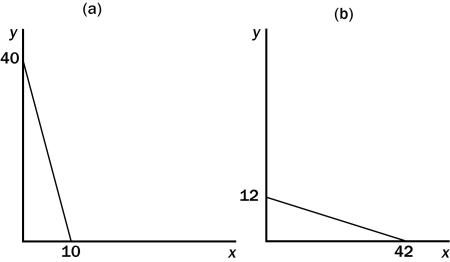 -Refer to Figure 21-3.In graph (a),if income is equal to $120,the price of good y is
(Multiple Choice)
4.9/5 (31)
One of the primary research results in tax policy analysis over the last 20 years is that
(Multiple Choice)
4.8/5 (40)
A consumer has preferences over two goods: books and movies.Two bundles,which lie on the same indifference curve for this consumer,are shown in the table below.  Which of the following bundles could not lie on the same indifference curve with A and B and satisfy the four properties of indifference curves?
(Multiple Choice)
4.7/5 (38)
An increase in income will cause a shift in the budget constraint
(Multiple Choice)
4.9/5 (33)
Figure 21-9
-Refer to Figure 21-9.Assume that the consumer depicted in the figure has an income of $40.If the price of chocolate chips is $4.00 and the price of marshmallows is $4.00,the optimizing consumer would choose to purchase
(Multiple Choice)
4.9/5 (38)
Figure 21-1
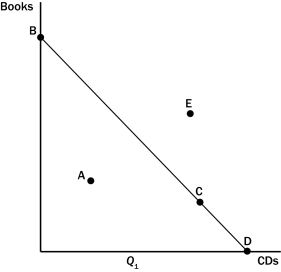 -Refer to Figure 21-1.All of the points identified in the figure represent possible consumption options with the exception of
(Multiple Choice)
4.9/5 (42)
Draw indifference curves that reflect the following preferences.
a.Pencils with white erasers and pencils with pink erasers
b.Left shoes and right shoes
c.Potatoes and rice
d.Income and polluted water
(Essay)
4.9/5 (36)
The following diagram shows two budget lines: A and B. 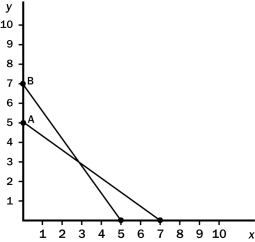 Which of the following could explain the change in the budget line from A to B?
(Multiple Choice)
4.9/5 (41)
Figure 21-2
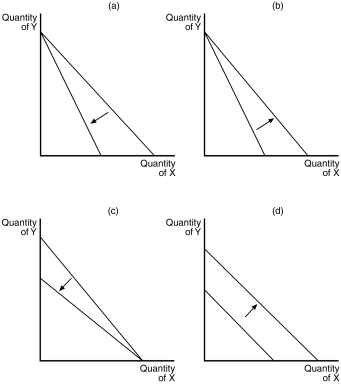 -Refer to Figure 21-2.Which of the graphs in the figure could reflect a decrease in the prices of both goods?
(Multiple Choice)
4.7/5 (39)
Figure 21-5
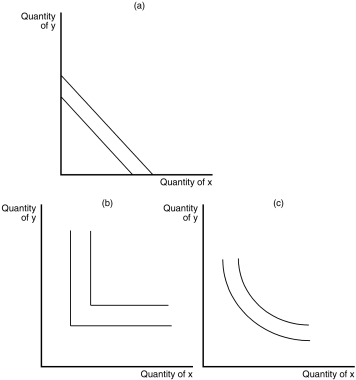 -Refer to Figure 21-5.Which of the graphs shown may represent indifference curves?
(Multiple Choice)
4.8/5 (36)
Which of the following is a property of indifference curves?
(Multiple Choice)
4.8/5 (34)
Filters
- Essay(0)
- Multiple Choice(0)
- Short Answer(0)
- True False(0)
- Matching(0)