Exam 7: The Normal Probability Distributions
Exam 1: Data Collection34 Questions
Exam 2: Organizing and Summarizing Data30 Questions
Exam 3: Numerically Summarizing Data66 Questions
Exam 4: Describing the Relation Between Two Variables92 Questions
Exam 5: Probability91 Questions
Exam 6: Discrete Probability Distributions32 Questions
Exam 7: The Normal Probability Distributions36 Questions
Exam 8: Sampling Distributions12 Questions
Exam 9: Estimating the Value of a Parameter Using Confidence Intervals24 Questions
Exam 10: Hypothesis Tests Regarding a Parameter36 Questions
Exam 11: Inference on Two Samples65 Questions
Exam 12: Inference on Categorical Data16 Questions
Exam 13: Comparing Three or More Means15 Questions
Exam 14: Inference of the Least-Squares Regression Model28 Questions
Select questions type
Use a normal probability plot to asses whether the sample data could have come from a population that is normally distributed.
-An industrial psychologist conducted an experiment in which 40 employees that were identified as "chronically tardy" by their managers were divided into two groups of size 20. Group 1 participated in the new "It's Great to be Awake!" program, while Group 2 had their pay pay docked. The following data represent the number of minutes that employees in Group 1 were late for work after participating in the program. 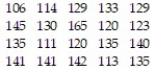
Free
(Multiple Choice)
4.8/5  (39)
(39)
Correct Answer: Verified
B
Find the indicated z-score.
-Find the z-score for which the area under the standard normal curve to its right is 0.70.
Free
(Multiple Choice)
4.8/5 (32)
Correct Answer:Verified
A
Find the sum of the areas under the standard normal curve to the left of z = -1.25 and to the right of 
Free
(Multiple Choice)
4.8/5 (34)
Correct Answer:Verified
D
Find the indicated z-score.
-Find the z-scores for which 90% of the distribution's area lies between -z and z.
(Multiple Choice)
4.9/5 (35)
Find the indicated probability.
-Assume that the random variable X is normally distributed, with mean  and standard deviation
  Compute the probability P(X > 114).
(Multiple Choice)
4.9/5 (40)
Find the indicated probability.
-Assume that the random variable X is normally distributed, with mean  and standard deviation
  Compute the probability P(X < 70).
(Multiple Choice)
4.9/5 (25)
Find the indicated z-score.
-Determine the two z-scores that separate the middle 87.4% of the distribution from the area in the tails of the standard normal distribution.
(Multiple Choice)
4.7/5 (29)
The amount of soda a dispensing machine pours into a 12 ounce can of soda follows a normal distribution with a mean of 12.36 ounces and a standard deviation of 0.24 ounce. The cans only hold 12.60 ounces of soda. Every can that has more than 12.60 ounces of soda poured into it causes a spill and the can needs to go through a special cleaning process before it can be sold. What is the probability a randomly selected can will need to go through this process?
(Multiple Choice)
4.8/5 (33)
Determine the area under the standard normal curve that lies between:
-z = -2 and z = -0.7
(Multiple Choice)
4.9/5 (33)
Find the indicated z-score.
-Determine the two z-scores that separate the middle 96% of the distribution from the area in the tails of the standard normal distribution.
(Multiple Choice)
4.9/5 (40)
Compare a graph of the normal density function with mean of 0 and standard deviation of 1 with a graph of a normal density function with mean equal to 0 and standard deviation of 0.5. The graphs would
(Multiple Choice)
4.9/5 (39)
Find the indicated z-score.
-Find the z-score for which the area under the standard normal curve to its left is 0.09.
(Multiple Choice)
4.8/5 (41)
You are performing a study about the weight of preschoolers. A previous study found the weights to be normally distributed with a mean of 30 and a standard deviation of 4. You randomly sample 30 preschool children and find their weights to be as follows. 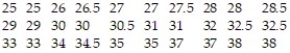 a) Draw a histogram to display the data. Is it reasonable to assume that the weights are normallydistributed? Why?
b) Find the mean and standard deviation of your sample.
c) Is there a high probability that the mean and standard deviation of your sample are consistentwith those found in previous studies? Explain your reasoning.
a) Draw a histogram to display the data. Is it reasonable to assume that the weights are normallydistributed? Why?
b) Find the mean and standard deviation of your sample.
c) Is there a high probability that the mean and standard deviation of your sample are consistentwith those found in previous studies? Explain your reasoning.
(Essay)
4.9/5 (41)
Find the indicated probability.
-Assume that the random variable X is normally distributed, with mean  and standard deviation
  Compute the probability P( 38 < X < 70).
(Multiple Choice)
4.8/5 (41)
Find the indicated z-score.
-Find the z-score for which the area under the standard normal curve to its left is 0.40
(Multiple Choice)
4.8/5 (27)
Find the indicated z-score.
-Find the z-score for which the area under the standard normal curve to its left is 0.70.
(Multiple Choice)
4.8/5 (34)
Find the indicated z-score.
-Find the z-scores for which 98% of the distribution's area lies between -z and z.
(Multiple Choice)
4.8/5 (31)
A brewery has a beer dispensing machine that dispenses beer into the company's 12 ounce bottles. The distribution for the amount of beer dispensed by the machine follows a normal distribution with a standard deviation of 0.14 ounce. The company can control the mean amount of beer dispensed by the machine. What value of the mean should the company use if it wants to guarantee that 98.5% of the bottles contain at least 12 ounces (the amount on the label)? Round to the nearest thousandth.
(Multiple Choice)
4.8/5 (24)
Find the indicated percentile.
-Assume that the random variable X is normally distributed with mean  and standard deviation
  Find the 55th percentile for X.
(Multiple Choice)
4.9/5 (33)
Filters
- Essay(0)
- Multiple Choice(0)
- Short Answer(0)
- True False(0)
- Matching(0)