Exam 4: Describing the Relation Between Two Variables
Exam 1: Data Collection34 Questions
Exam 2: Organizing and Summarizing Data30 Questions
Exam 3: Numerically Summarizing Data66 Questions
Exam 4: Describing the Relation Between Two Variables92 Questions
Exam 5: Probability91 Questions
Exam 6: Discrete Probability Distributions32 Questions
Exam 7: The Normal Probability Distributions36 Questions
Exam 8: Sampling Distributions12 Questions
Exam 9: Estimating the Value of a Parameter Using Confidence Intervals24 Questions
Exam 10: Hypothesis Tests Regarding a Parameter36 Questions
Exam 11: Inference on Two Samples65 Questions
Exam 12: Inference on Categorical Data16 Questions
Exam 13: Comparing Three or More Means15 Questions
Exam 14: Inference of the Least-Squares Regression Model28 Questions
Select questions type
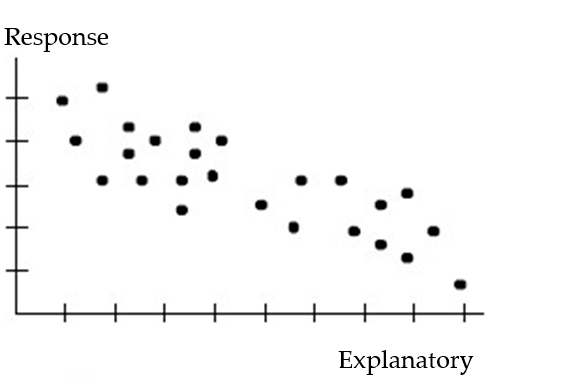
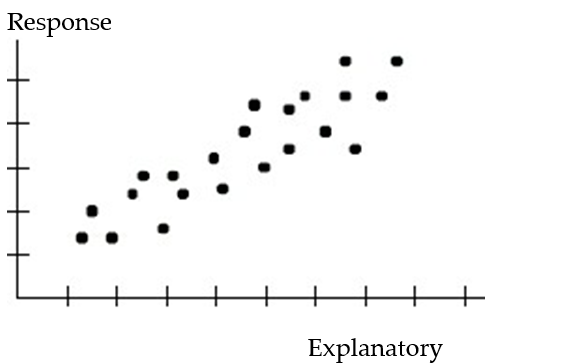
Choose the coefficient of determination that matches the scatterplot. Assume that the scales on the horizontal and vertical axes are the same.
-
Free
(Multiple Choice)
4.8/5  (26)
(26)
Correct Answer: Verified
C
Construct a conditional distribution by x for the given contingency table. Round valuese to the nearest thousandth. 
Free
(Multiple Choice)
4.9/5 (37)
Correct Answer:Verified
A
Compute the linear correlation coefficient between the two variables and determine whether a linear relation exists.
-The table below shows the scores on an end-of-year project of 10 randomly selected architecture students and the number of days each student spent working on the project. 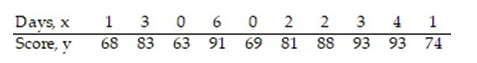
Free
(Multiple Choice)
4.7/5 (27)
Correct Answer:Verified
A
Use the regression equation to predict the value of y for x = -3.4. 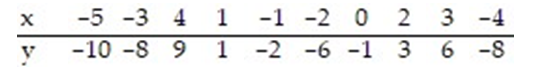
(Multiple Choice)
4.8/5 (37)
The regression line for the given data is  = 5.044x + 56.11. Determine the residual of a data point for which x = 4 and y = 78.
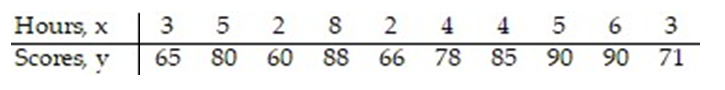
(Multiple Choice)
4.7/5 (38)
Each year a nationally recognized publication conducts its "Survey of America's Best Graduate and Professional Schools." An academic advisor wants to predict the typical starting salary of a graduate at a top business school using GMAT score of the school as a predictor variable. Total GMAT scores range from 200 to 800. A simple linear regression of SALARY versus GMAT using 25 data points shown below.  -Give a practical interpretation of
  = 228.
(Multiple Choice)
4.8/5 (46)
A medical researcher wishes to determine if there is a relationship between the number of prescriptions written by pediatricians and the ages of the children for whom the prescriptions are written. She surveys all the pediatricians in a geographical region to collect her data. What is the response variable?
(Multiple Choice)
4.9/5 (30)
Compute the linear correlation coefficient between the two variables and determine whether a linear relation exists.
-
(Multiple Choice)
4.9/5 (34)
The regression line for the given data is  = 6.91x + 46.26. Determine the residual of a data point for which x = 2 and y = 58.
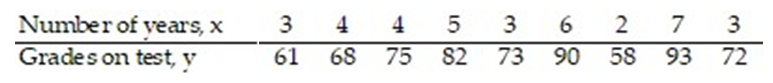
(Multiple Choice)
4.7/5 (30)
A real estate magazine reported the results of a regression analysis designed to predict the price (y), measured in dollars, of residential properties recently sold in a northern Virginia subdivision. One independent variable used to predict sale price is GLA, gross living area (x), measured in square feet. Data for 157 properties were used to fit the model, E(y) =  +
+  x. The results of the simple linear regression are provided below.
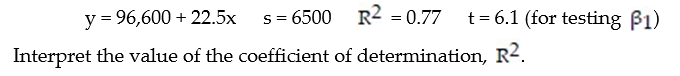
(Multiple Choice)
4.9/5 (31)
The regression line for the given data is  = 1.488x + 60.46. Determine the residual of a data point for which x = 41 and y = 120.
(Multiple Choice)
4.8/5 (31)
The data below are the ages and systolic blood pressure (measured in Millimeters of mercury) of 9 randomly selected adults. 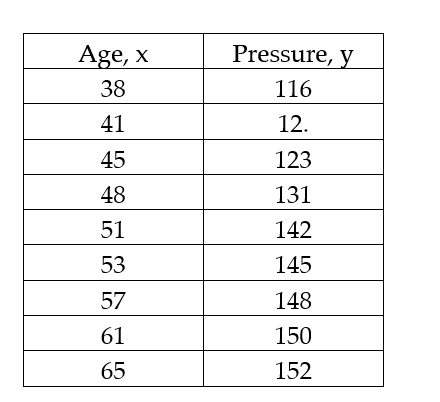
(Multiple Choice)
4.8/5 (41)
Compute the linear correlation coefficient between the two variables and determine whether a linear relation exists.
-To investigate the relationship between yield of soybeans and the amount of fertilizer used, a researcher divides a field into eight plots of equal size and applies a different amount of fertilizer to each plot. The table shows the yield of soybeans and the amount of fertilizer used for each plot. 
(Multiple Choice)
4.8/5 (45)
Compute the linear correlation coefficient between the two variables and determine whether a linear relation exists.
-The table below shows the ages and weights (in pounds) of 9 randomly selected tennis coaches. 
(Multiple Choice)
4.9/5 (45)
Choose the coefficient of determination that matches the scatterplot. Assume that the scales on the horizontal and vertical axes are the same.
-
(Multiple Choice)
4.8/5 (27)
In one area of Russia, records were kept on the relationship between the rainfall (in inches) and the yield of wheat (bushels per acre). The data for a 9 year period is as follows: 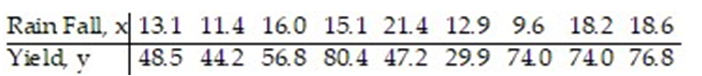 The equation of the line of least squares is given as
  = -9.12 + 4.38x.
-How many bushels of wheat per acre can be predicted if it is expected that there will be 17 inches of rain?
= -9.12 + 4.38x.
-How many bushels of wheat per acre can be predicted if it is expected that there will be 17 inches of rain?
(Multiple Choice)
4.9/5 (39)
Construct a frequency marginal distribution for the given contingency table. 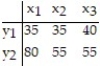
(Multiple Choice)
4.7/5 (35)
A history instructor has given the same pretest and the same final examination each semester. He is interested in determining if there is a relationship between the scores of the two tests. He computes the linear correlation coefficient and notes that it is 1.15. What does this correlation coefficient value tell the instructor?
(Multiple Choice)
4.9/5 (35)
The data below represent the numbers of absences and the final grades of 15 randomly selected students from an astronomy class. Construct a scatter diagram for the data. Do you detect a trend? 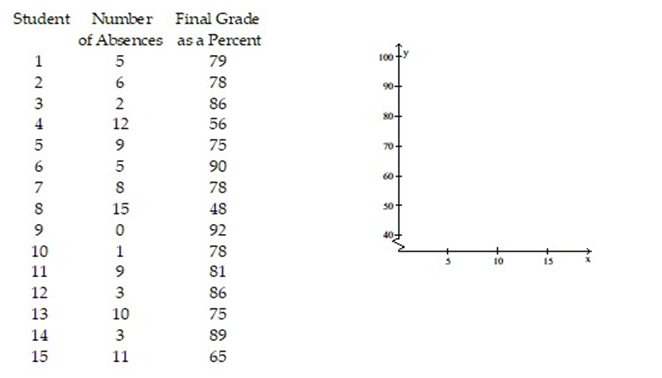
(Essay)
4.8/5 (23)
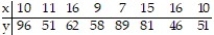
Calculate the linear correlation coefficient for the data below. 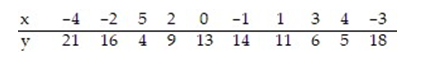
(Multiple Choice)
4.7/5 (39)
Filters
- Essay(0)
- Multiple Choice(0)
- Short Answer(0)
- True False(0)
- Matching(0)