Exam 11: Polynomial and Rational Functions
Exam 1: Linear Functions and Change125 Questions
Exam 2: Functions107 Questions
Exam 3: Quadratic Functions41 Questions
Exam 4: Exponential Functions102 Questions
Exam 5: Logarithmic Functions79 Questions
Exam 6: Transformations of Functions and Their Graphs100 Questions
Exam 7: Trigonometry in Circles and Triangles120 Questions
Exam 8: Trigonometric Functions120 Questions
Exam 9: Trigonometric Identities and Their Applications60 Questions
Exam 10: Compositions, Inverses, and Combinations of Functions64 Questions
Exam 11: Polynomial and Rational Functions143 Questions
Exam 12: Vectors and Matrices102 Questions
Exam 13: Sequences and Series81 Questions
Exam 14: Parametric Equations and Conic Sections120 Questions
Select questions type
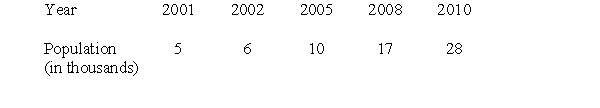
The squirrel population in a certain area is estimated each year and recorded in the table below. Suppose the squirrel population in a given year is a function of the number of years since 1998.
-Fit a cubic function to the data and use it to estimate the squirrel population (rounded to the nearest whole number) in 2015.

(Short Answer)
4.9/5  (30)
(30)
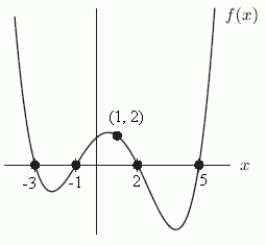
The formula for the function graphed below has leading term  (i.e.
(i.e.  + terms of lower degree). If n is as small as possible, then n = _____ and a = _____.
(Short Answer)
4.8/5 (28)
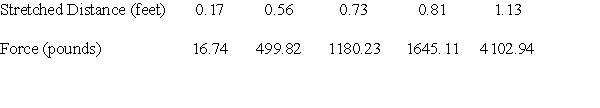
George measures the force exerted by a certain spring when it is stretched various distances beyond its natural length. The data he gathers is compiled in the following table.
- He wishes to describe the force as a function of the stretched distance, and decides to use a quadratic function model. After fitting a quadratic function to the data, he uses it to estimate the force when the spring is stretched 19 inches. What is his approximation (to three decimal places) of this force?
(Short Answer)
4.8/5 (37)
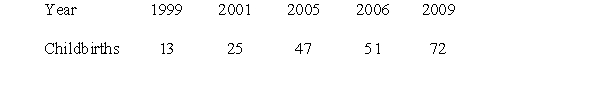
The number of yearly childbirths for a growing town are recorded in the table below. Suppose the number of childbirths each year is a function of the number of years since 1996. Fit a power function to the data and use it to estimate the number of childbirths (rounded to the nearest whole number) in 2012.
(Short Answer)
4.8/5 (33)
The graphs of![The graphs of And Are shown in the figure below as viewed on the window [-10, 10] by [-25, 25]. What happens as the viewing window is expanded?](https://storage.examlex.com/TB10073/11ee8201_b9e6_e8a8_8e66_11c1f6e4441b_TB10073_11.jpg) And
And
![The graphs of And Are shown in the figure below as viewed on the window [-10, 10] by [-25, 25]. What happens as the viewing window is expanded?](https://storage.examlex.com/TB10073/11ee8201_b9e6_e8a9_8e66_7f51a112e36b_TB10073_11.jpg) Are shown in the figure below as viewed on the window [-10, 10] by [-25, 25]. What happens as the viewing window is expanded?
Are shown in the figure below as viewed on the window [-10, 10] by [-25, 25]. What happens as the viewing window is expanded?
![The graphs of And Are shown in the figure below as viewed on the window [-10, 10] by [-25, 25]. What happens as the viewing window is expanded?](https://storage.examlex.com/TB10073/11ee8201_b9e6_e8aa_8e66_2d15bc8d8eef_TB10073_00.jpg)
(Multiple Choice)
4.8/5 (37)
The infant mortality, I, in a country is related to the country's GNP (gross national product), g. Some authors (Weld and Helms, 1971) have argued that the relationship is of the form  , where
  , k, and a are positive constants and
  . For
. For  , k = 4, and a = 2, the vertical intercept of the graph of I against g is at I = _____. If there is no vertical intercept, enter "none".
(Short Answer)
4.7/5 (34)
The squirrel population in a certain area is estimated each year and recorded in the table below. Suppose the squirrel population in a given year is a function of the number of years since 1998. Fit an exponential function to the data and use it to estimate the squirrel population (rounded to the nearest whole number) in 2013.
(Short Answer)
4.9/5 (37)
The profit earned by a producer to manufacture and sell  units of a good is given by
  . The average profit for
  units is given by
  A) Compute
  B) Interpret the economic significance of the values in part (A).
C) What trend do you notice in the values of
B) Interpret the economic significance of the values in part (A).
C) What trend do you notice in the values of  as
as  gets large? Explain this trend in economic terms.
(Essay)
4.8/5 (44)
Find the equation of the vertical line through the
 -intercept of the graph
  .
.
(Short Answer)
4.8/5 (36)
Filters
- Essay(0)
- Multiple Choice(0)
- Short Answer(0)
- True False(0)
- Matching(0)