Exam 11: Polynomial and Rational Functions
Exam 1: Linear Functions and Change125 Questions
Exam 2: Functions107 Questions
Exam 3: Quadratic Functions41 Questions
Exam 4: Exponential Functions102 Questions
Exam 5: Logarithmic Functions79 Questions
Exam 6: Transformations of Functions and Their Graphs100 Questions
Exam 7: Trigonometry in Circles and Triangles120 Questions
Exam 8: Trigonometric Functions120 Questions
Exam 9: Trigonometric Identities and Their Applications60 Questions
Exam 10: Compositions, Inverses, and Combinations of Functions64 Questions
Exam 11: Polynomial and Rational Functions143 Questions
Exam 12: Vectors and Matrices102 Questions
Exam 13: Sequences and Series81 Questions
Exam 14: Parametric Equations and Conic Sections120 Questions
Select questions type
If the function 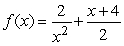 is written in the form
  , a ratio of polynomials, which of the following could be
  ?
?
(Multiple Choice)
4.8/5  (40)
(40)
One of the following tables of data comes from a linear function, one from an exponential function, and one from a power function. The formula for the power function is  with a = _____ and b = _____.
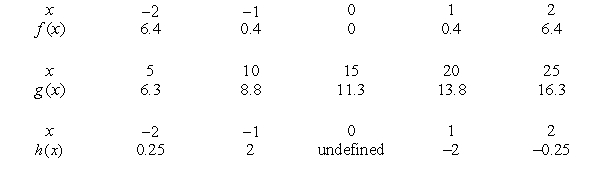
(Short Answer)
4.9/5 (36)
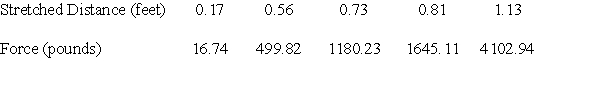
George measures the force exerted by a certain spring when it is stretched various distances beyond its natural length. The data he gathers is compiled in the following table.
- He wishes to describe the force as a function of the stretched distance, and decides to use a cubic function model. After fitting a cubic function to the data, he uses it to estimate the force when the spring is stretched 22 inches. What is his approximation (to three decimal places) of this force?
(Short Answer)
4.8/5 (32)
Determine the vertical and horizontal asymptotes, if they exist, of the function
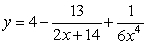
(Short Answer)
4.7/5 (27)
The following figure gives the graphs of  and
and  .
.  Which is smaller, a or b?
(Short Answer)
4.9/5 (39)
The formula for the exponential function shown in the following table is  , where a = _____ and b = _____. Round both answers to 2 decimal places.

(Short Answer)
4.7/5 (38)
Which of the following could be a formula for the graph shown below? 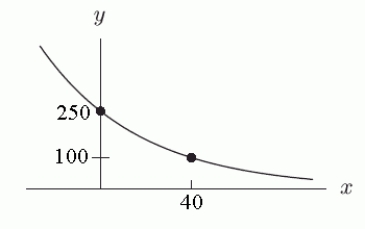
(Multiple Choice)
4.8/5 (37)
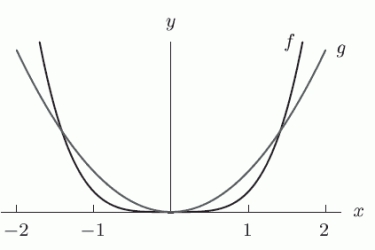
The function  Can be approximated by the function
 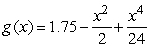 . On what interval do the two graphs look similar?
(Multiple Choice)
4.8/5 (30)
Let  Satisfy the conditions
  ,
,
 , and
, and
 . Which of the following must be true?
(Multiple Choice)
5.0/5 (37)
The following graphs are of functions of the form 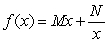 , where M and N are constants. Which graph has M > 0 and N < 0?
(Multiple Choice)
4.8/5 (44)
The graphs of ![The graphs of and are shown in the figure below as viewed on the window [-10, 10] by [-25, 25]. What is the zero of ?](https://storage.examlex.com/TB10073/11ee8201_b9e6_c194_8e66_254455d23e4d_TB10073_11.jpg) and
and ![The graphs of and are shown in the figure below as viewed on the window [-10, 10] by [-25, 25]. What is the zero of ?](https://storage.examlex.com/TB10073/11ee8201_b9e6_c195_8e66_3765c0ddc693_TB10073_11.jpg) are shown in the figure below as viewed on the window [-10, 10] by [-25, 25]. What is the zero of
are shown in the figure below as viewed on the window [-10, 10] by [-25, 25]. What is the zero of ![The graphs of and are shown in the figure below as viewed on the window [-10, 10] by [-25, 25]. What is the zero of ?](https://storage.examlex.com/TB10073/11ee8201_b9e6_c196_8e66_151747dbdc3c_TB10073_11.jpg) ?
?
![The graphs of and are shown in the figure below as viewed on the window [-10, 10] by [-25, 25]. What is the zero of ?](https://storage.examlex.com/TB10073/11ee8201_b9e6_c197_8e66_59a07eb819a0_TB10073_00.jpg)
(Short Answer)
4.8/5 (27)
Which of the following are possible formulas for a fourth degree polynomial with at least one zero at  , a double zero at
  , and long-run behavior: as
  .
.
(Multiple Choice)
4.8/5 (28)
A right circular cylinder has a volume of 126 cubic meters. The least possible surface area for the cylinder is approximately:
(Multiple Choice)
4.9/5 (45)
The following table represents the amount of monthly data handled by MichNet, the University of Michigan's gateway to the Internet, sampled at six month intervals for the years 1993-1995. (The data is from the Michigan Daily, March 30, 1996, p.4.)
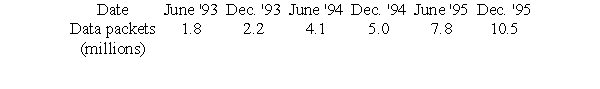 Let d be the number of data packets handled monthly (in billions), and t be time in years since December, 1992. Find equations for the best fit exponential function and the best fit power function that model these data (you do not have to enter your equations). By comparing their correlation coefficients, choose which model gives a better fit.
A) The exponential model
B) The power function model
Let d be the number of data packets handled monthly (in billions), and t be time in years since December, 1992. Find equations for the best fit exponential function and the best fit power function that model these data (you do not have to enter your equations). By comparing their correlation coefficients, choose which model gives a better fit.
A) The exponential model
B) The power function model
(Short Answer)
4.8/5 (35)
Filters
- Essay(0)
- Multiple Choice(0)
- Short Answer(0)
- True False(0)
- Matching(0)