Exam 11: Polynomial and Rational Functions
Exam 1: Linear Functions and Change125 Questions
Exam 2: Functions107 Questions
Exam 3: Quadratic Functions41 Questions
Exam 4: Exponential Functions102 Questions
Exam 5: Logarithmic Functions79 Questions
Exam 6: Transformations of Functions and Their Graphs100 Questions
Exam 7: Trigonometry in Circles and Triangles120 Questions
Exam 8: Trigonometric Functions120 Questions
Exam 9: Trigonometric Identities and Their Applications60 Questions
Exam 10: Compositions, Inverses, and Combinations of Functions64 Questions
Exam 11: Polynomial and Rational Functions143 Questions
Exam 12: Vectors and Matrices102 Questions
Exam 13: Sequences and Series81 Questions
Exam 14: Parametric Equations and Conic Sections120 Questions
Select questions type
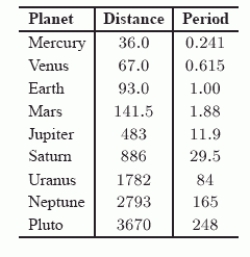
The following table contains the names of the nine known planets that orbit about the sun, along with their distance d from the sun in millions of miles and the period P of the revolution about the sun in standard earth years, that is, the time it takes the planet to go around the sun. (For this problem ,we will assume that Pluto is a planet).
 Let
Let  Suppose a tenth planet is discovered at a distance of 5.4 billion (i.e. 5400 million) miles from the sun. Use the best-fit power model for the data to estimate the number of years in the period of the new planet to the nearest year.
(Short Answer)
4.9/5  (46)
(46)
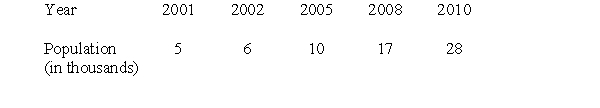
The squirrel population in a certain area is estimated each year and recorded in the table below. Suppose the squirrel population in a given year is a function of the number of years since 1998.
-Fit a power function to the data and use it to estimate the squirrel population (rounded to the nearest whole number) in 2018.
(Short Answer)
4.7/5 (37)
Which of the following statements describe the graph of  ? Mark all that apply.
(Multiple Choice)
4.8/5 (32)
The following table represents the amount of monthly data handled by MichNet, the University of Michigan's gateway to the Internet, sampled at six month intervals for the years 1993-1995. (The data is from the Michigan Daily, March 30, 1996, p.4.) The article also stated that the data handling capacity of the MichNet system was about 40 billion data packets per month.
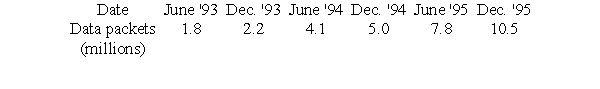 Let d be the number of data packets handled monthly (in billions), and t be time in years since December, 1992. Find an equation for the best fit exponential function that models these data (you do not have to enter your equation). Use this equation to determine in what year the network became overloaded.
(Short Answer)
4.8/5 (42)
Use a graphing calculator or computer to graph 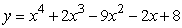 . Use the graph to pick the factored form of y.
(Multiple Choice)
4.7/5 (37)
Perform the operations and then express the answer in reduced form:

(Short Answer)
4.9/5 (32)
The graph of 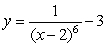 is a transformation of the graph of
  for some
  . Which of the following correctly describes the transformation?
(Multiple Choice)
4.9/5 (40)
Which of the following statements are true for 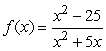 ? Mark all that apply.
(Multiple Choice)
4.9/5 (40)
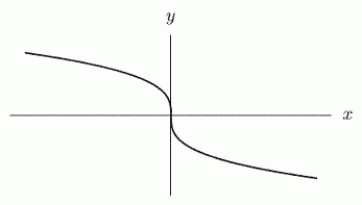
The following figure shows the graph of a power function,  , whose formula has the form
  Which of the following statements are true? Mark all that apply.
(Multiple Choice)
4.9/5 (36)
Can  be written in the form of an exponential function, a power function, or neither?
(Multiple Choice)
4.8/5 (45)
Must the sum of two functions with horizontal asymptotes also have a horizontal asymptote?
(True/False)
4.8/5 (43)
The following figure gives the graphs of four power functions. Which one could be the graph of  ? If none of the graphs match, enter "none".
(Multiple Choice)
4.7/5 (41)
A right circular cylinder has a volume of 121 cubic meters.
a) What is the formula for surface area in terms of the radius, r , of the base of the cylinder?
b) Approximate the least possible surface area for the cylinder.
c) Approximate the radius necessary to achieve the minimum surface area.
(Essay)
4.9/5 (40)
Filters
- Essay(0)
- Multiple Choice(0)
- Short Answer(0)
- True False(0)
- Matching(0)