Exam 3: Relations and Functions
Exam 1: Fundamentals of Algebra120 Questions
Exam 2: Polynomials and Absolute Value52 Questions
Exam 3: Relations and Functions92 Questions
Exam 4: Systems of Linear Equations90 Questions
Exam 5: Rational Expressions, Equations and Functions121 Questions
Exam 6: Radical Expressions, Equations and Functions71 Questions
Exam 7: Quadratic Expressions, Equations and Functions105 Questions
Exam 8: Exponential and Logarithmic Expressions, Equations and Functions48 Questions
Exam 9: Conic Sections Systems of Non-Linear Equations73 Questions
Exam 10: Sequences, Series and the Binomial Theorem60 Questions
Select questions type
Use the bar graph.
The bar graph shows the number of tornado reports each decade since the 1950s
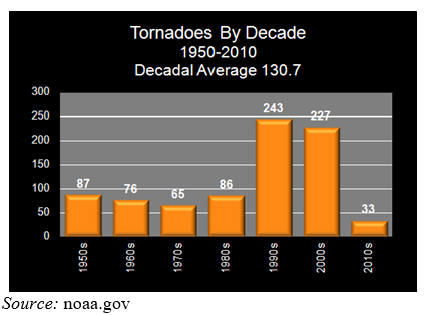 -Use roster notation to represent the correspondence between the decade (the input) and the number of tornado reportings (the output).
(Multiple Choice)
4.8/5  (30)
(30)
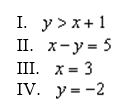
Which of the equations or inequalities represents a function?
(Multiple Choice)
4.8/5 (32)
Change the function  So that its graph is shifted vertically down 15 units.
(Multiple Choice)
4.7/5 (42)
A function is  . When the input value of the function is
  , what is the output value?
(Multiple Choice)
4.9/5 (39)
Use interval notation to represent the range of the function whose graph is shown. 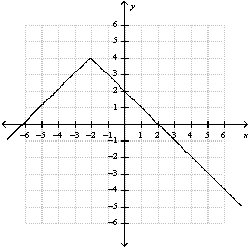
(Multiple Choice)
4.9/5 (45)
Use algebra to find any real zeros of the absolute value function 
(Multiple Choice)
4.8/5 (39)
Use the quadratic function n  to answer the questions.
-Identify the maximum or minimum output value.
to answer the questions.
-Identify the maximum or minimum output value.
(Multiple Choice)
4.9/5 (36)
A 1200 foot long fence is being painted. After 2 hours, 96 feet has to be painted. Find the average rate of change in the number of unpainted fence per hour.
(Multiple Choice)
4.7/5 (41)
Change the function  So that its graph is shifted horizontally left 3 units and vertically up 7 units.
(Multiple Choice)
4.8/5 (33)
Use algebra to find any real zeros of the absolute value function 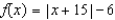
(Multiple Choice)
4.8/5 (31)
A truck has a 62-gallon gas tank. It gets an average of 10 miles per gallon when driven on the freeway.
-Write a linear function that models the amount of gas left in the tank,  , after driving
  Miles on the freeway.
(Multiple Choice)
4.7/5 (40)
Use the given graph of a quadratic function. 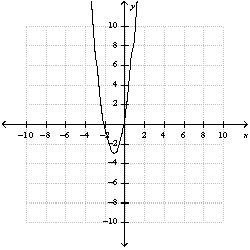 -Identify any real zeros.
(Multiple Choice)
4.9/5 (41)
An absolute value function has vertex  and opens up. Use interval notation to represent the range.
(Multiple Choice)
5.0/5 (39)
Change the function  So that its graph is shifted up 4 units.
(Multiple Choice)
4.9/5 (33)
Filters
- Essay(0)
- Multiple Choice(0)
- Short Answer(0)
- True False(0)
- Matching(0)