Exam 1: Linear Functions and Change
Exam 1: Linear Functions and Change148 Questions
Exam 2: Functions138 Questions
Exam 3: Quadratic Functions46 Questions
Exam 4: Exponential Functions94 Questions
Exam 5: Logarithmic Functions87 Questions
Exam 6: Transformations of Functions and Their Graphs85 Questions
Exam 7: Trigonometry and Periodic Functions178 Questions
Exam 8: Triangle Trigonometry and Polar Coordinates43 Questions
Exam 9: Trigonometric Identities, Models, and Complex Numbers106 Questions
Exam 10: Compositions, Inverses, and Combinations of Functions69 Questions
Exam 11: Polynomial and Rational Functions145 Questions
Exam 12: Vectors and Matrices104 Questions
Exam 13: Sequences and Series81 Questions
Exam 14: Parametric Equations and Conic Sections128 Questions
Select questions type
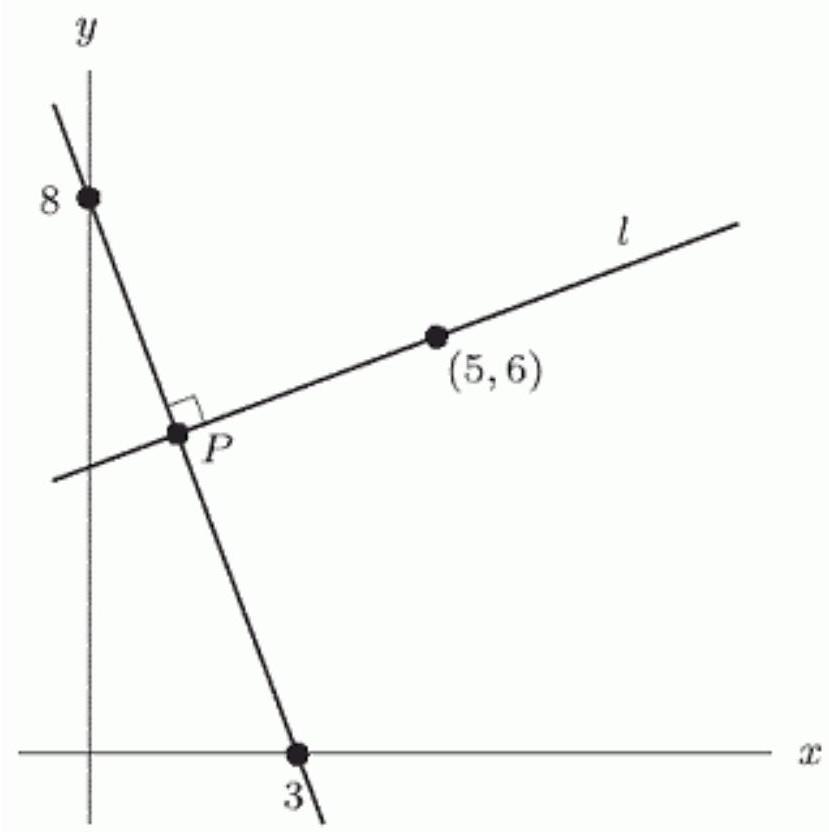
Find the -coordinate of the point shown in the following figure. Round to 3 decimal places.
(Short Answer)
5.0/5  (28)
(28)
You need to purchase a new computer printer. The cost of printer is , and its ink cartridges are each. The cost of printer is , and its ink cartridges are each. You estimate that you will need new ink cartridges about once a month. Find equations for the total cost of each printer after months and use them to determine when you would have invested about the same amount of money in each. Round to the nearest tenth of a month.
(Short Answer)
4.9/5 (26)
A wildlife ranger finds that there is a linear relationship between the number of bushels of corn distributed in a month and the number of deer at the park. If the ranger distributes no bushels of corn, there are 49 deer at the park. For each additional bushel of corn distributed, 7 more deer come to the park.
How many bushels of corn must be distributed in order to have 77 deer at the park?
(Multiple Choice)
4.9/5 (32)
Determine the point of intersection of the linear functions
y=2 x+4
y=3 x+7
(Short Answer)
4.9/5 (31)
The population of a pack of rats can be represented by the formula where represents the population in hundreds, and represents the time, in months, since January 2010. Which of the following is correct regarding the slope.
(Multiple Choice)
4.9/5 (35)
Mark all of the following functions that are neither increasing nor decreasing.
(Multiple Choice)
4.8/5 (32)
Consider the information in the following table.
 Could be a function of ?
(True/False)
4.8/5 (32)
Many economists believe that a country's inflation rate will rise if its unemployment rate falls. The following figure show the relationship between the inflation rate, , and the unemployment rate, , in four different countries.
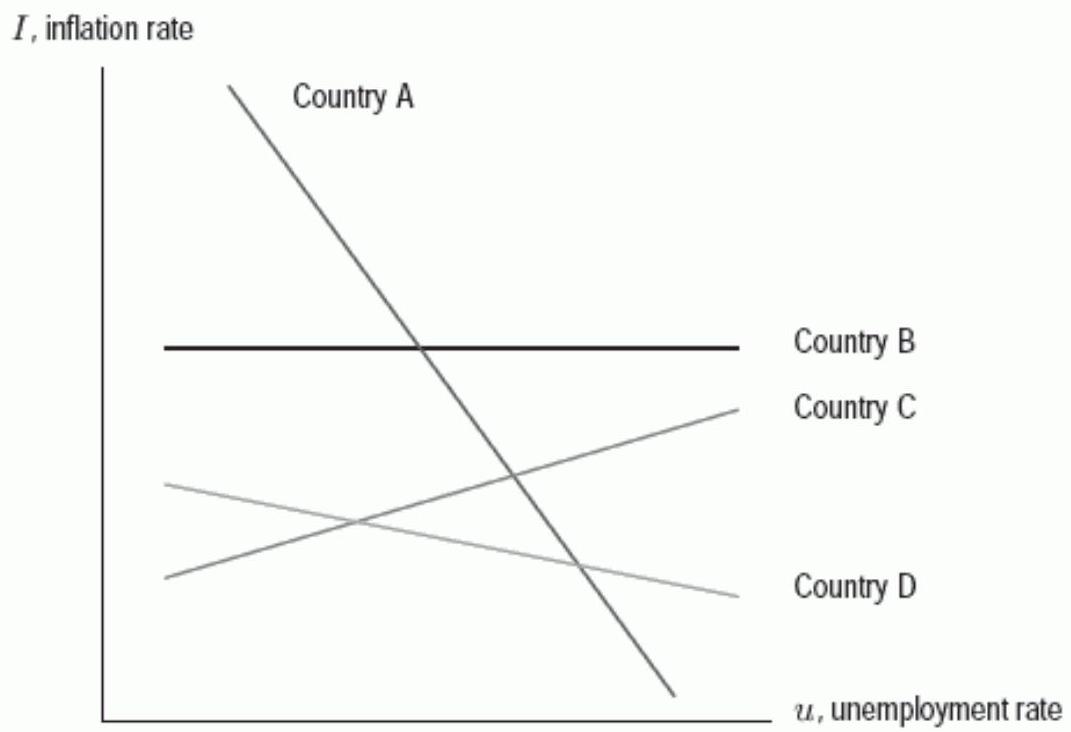 In which of the four countries does the relationship between the inflation rate and the unemployment rate seem opposite of what is normally expected?
(Short Answer)
4.7/5 (37)
If you were to draw a graph representing the total amount of concrete, , used to pour square feet of sidewalk, which axis would be on?
(Multiple Choice)
4.9/5 (34)
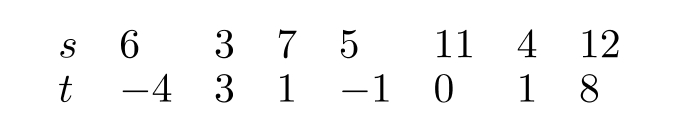
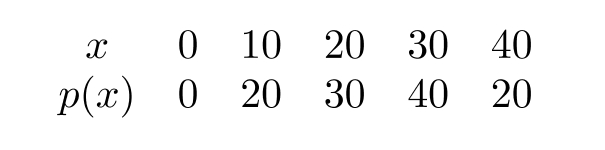
Use the following table to find . If there is more than one answer, enter the smallest first and separate them by semicolons.
(Short Answer)
4.9/5 (38)
Express this relationship in function notation (that is, is a function of is written ).
Calories burned, , is a function of activity, .
(Short Answer)
4.7/5 (32)
A salesman earns , where is the number of products sold, and is the weekly wage in dollars. What does the number 500 represent? (Mark all that apply)
(Multiple Choice)
4.8/5 (33)
A wildlife ranger finds that there is a linear relationship between the number of bushels of corn distributed in a month and the number of deer at the park. If the ranger distributes no bushels of corn, there are 49 deer at the park. For each additional bushel of corn distributed, 8 more deer come to the park.
a) If is the number of deer at the park and is the number of bushels of corn fed in a month, find a formula for in terms of .
b) How many deer are at the park if the ranger feeds 3 bushels of corn?
c) How many bushels of corn must be distributed in order to have 81 deer at the park?
(Short Answer)
4.9/5 (27)
Several years ago, the wild rabbits of Australia were seriously threatened by a virus that was accidentally released into their population. Suppose that the following table gives the number of rabbits (in millions) remaining months after the release of the virus.
t (months) 2 4 6 8 10 12 14 16 18 20 r (millions) 1940 1842 1649 1328 1140 898 765 502 296 104
Find the linear regression line for this data. Round to 3 decimal places.
(Short Answer)
4.7/5 (29)
Filters
- Essay(0)
- Multiple Choice(0)
- Short Answer(0)
- True False(0)
- Matching(0)