Exam 1: Linear Functions and Change
Exam 1: Linear Functions and Change148 Questions
Exam 2: Functions138 Questions
Exam 3: Quadratic Functions46 Questions
Exam 4: Exponential Functions94 Questions
Exam 5: Logarithmic Functions87 Questions
Exam 6: Transformations of Functions and Their Graphs85 Questions
Exam 7: Trigonometry and Periodic Functions178 Questions
Exam 8: Triangle Trigonometry and Polar Coordinates43 Questions
Exam 9: Trigonometric Identities, Models, and Complex Numbers106 Questions
Exam 10: Compositions, Inverses, and Combinations of Functions69 Questions
Exam 11: Polynomial and Rational Functions145 Questions
Exam 12: Vectors and Matrices104 Questions
Exam 13: Sequences and Series81 Questions
Exam 14: Parametric Equations and Conic Sections128 Questions
Select questions type
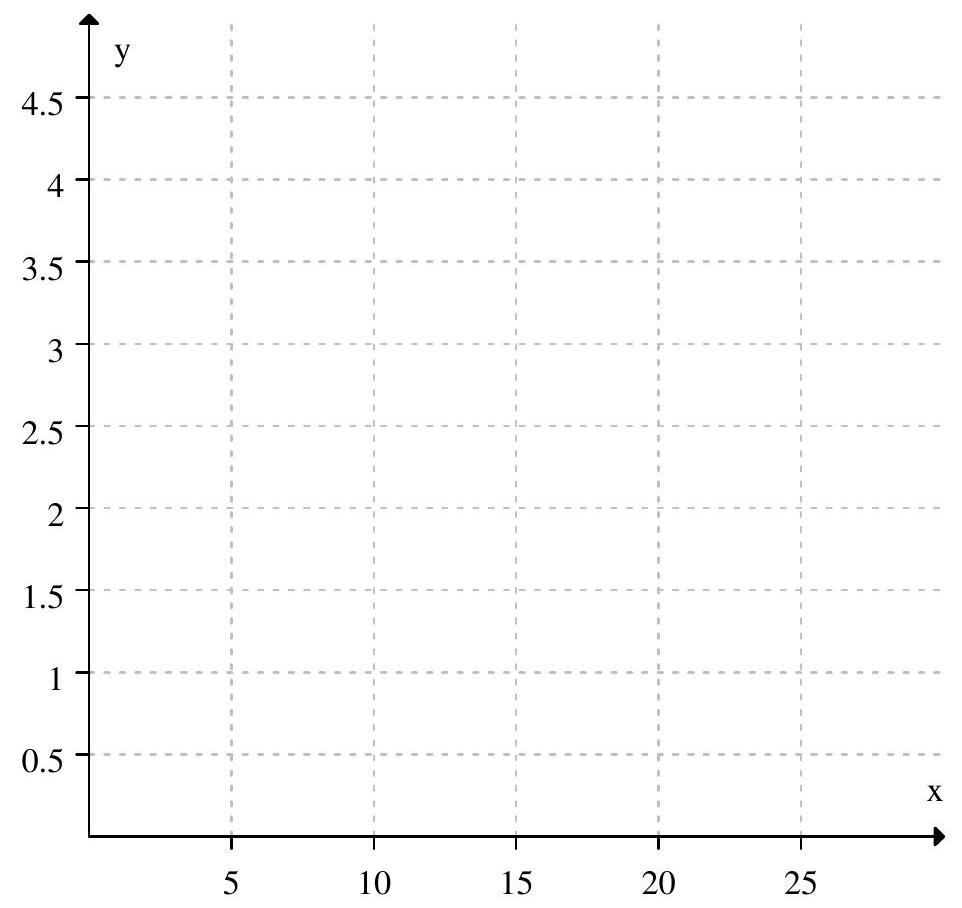
The following figure shows the graph of . Estimate between 5 and .
(Multiple Choice)
4.9/5  (32)
(32)
Which of the following graphs is mostly likely to represent the resale price of a car which depreciates steadily until it is worthless?
(Multiple Choice)
4.7/5 (31)
Let be the number of students (in thousands) attending MNO college years after 2000. Which of the following statements gives the meaning of the expression ?
(Multiple Choice)
4.8/5 (38)
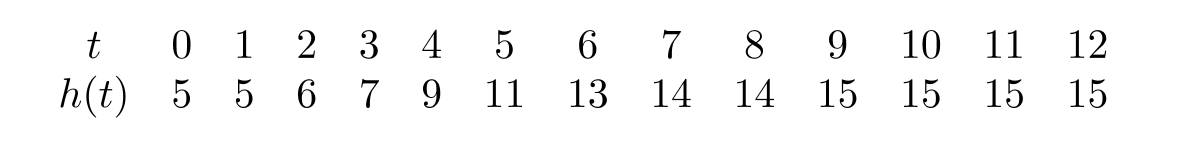
The following table shows the height of a tree (to the nearest foot) as a function of time (in years). What was the average rate of change in the height of the tree between and ?
(Short Answer)
4.8/5 (39)
The following table shows the relationship between , the side length of an equilateral triangle, , the perimeter of the triangle, and , the area of the triangle.
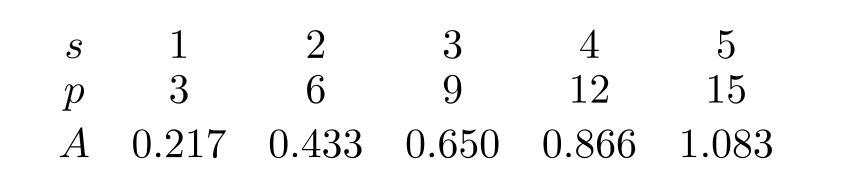 If is a linear function of , give its rate of change. If it is not linear, enter "not linear".
(Short Answer)
4.8/5 (26)
You have to spend on lunches this month. Each day, you can pack a lunch for about , or you can buy lunch at the cafeteria for . Let be the number of times you pack a lunch and be the number of times you buy lunch. The formula for in terms of is given by _____ - _____ . Round answers to 2 decimal places.
(Short Answer)
4.7/5 (33)
Several years ago, the wild rabbits of Australia were seriously threatened by a virus that was accidentally released into their population. Suppose that the following table gives the number of rabbits (in millions) remaining months after the release of the virus.
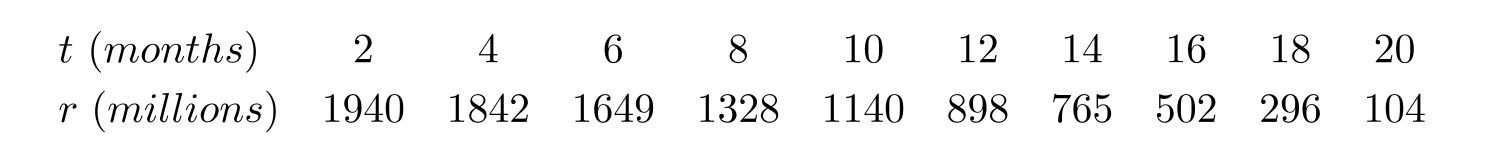 Use a calculator program to find the linear regression line for this data and use this to estimate how many million rabbits were left after 19 months. Round to the nearest whole number.
(Short Answer)
4.9/5 (38)
At a price of per gallon, the average weekly demand by consumers for gasoline is 43 gallons. If the price rises to , the weekly demand drops to 39 gallons. Assuming demand is linear, let , where is the weekly quantity of gasoline demanded and is the price per gallon. Then and
(Short Answer)
4.7/5 (50)
Find a formula for the linear function that has -intercept -3 and -intercept 9 . Express your answer in form.
(Short Answer)
4.8/5 (33)
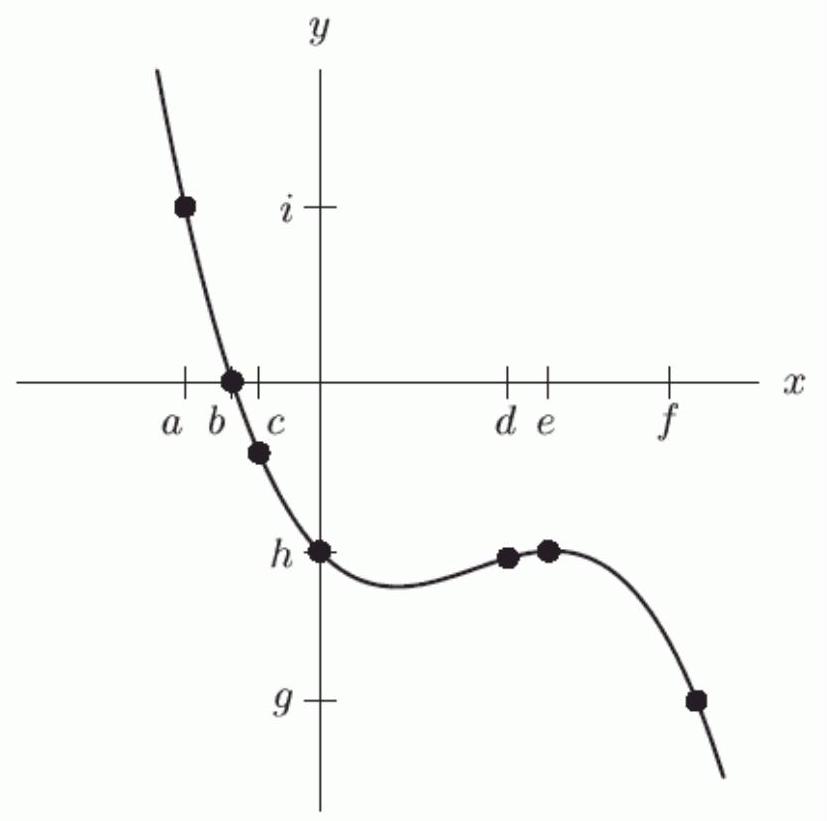
Let be defined by the following graph. If , what is ? If there is more than one answer, enter the smallest first and separate them by semicolons.
(Short Answer)
4.8/5 (35)
The population of a pack of rats can be represented by the formula where represents the population in hundreds, and represents the time, in months, since January 2010. Which of the following is correct regarding the vertical intercept?
(Multiple Choice)
5.0/5 (29)
A study was done that collected data on 100 individuals' grade point averages and the number of hours per week they spent working. A linear regression was done on this data and the corresponding correlation coefficient was 0.3. What does this tell you about the relationship between grade point averages and working?
(Multiple Choice)
4.7/5 (37)
Farmer Brown starts with 120 cows and the average rate of change of his herd is 9 cows per year. Farmer Jones starts his herd the same year with 170 cows and the average rate of change of his herd is 5 cows per year.
a) After 10 years, which farmer has the most cows?
b) After 20 years, which farmer has the most cows?
(Short Answer)
4.9/5 (28)
If and represent the population (in millions) of two countries, and , then in what year will the population of country double the population of country ? Round to 2 decimal places.
(Short Answer)
4.9/5 (34)
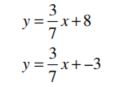
Are the lines represented by these equations parallel? Perpendicular? Or neither?
(Multiple Choice)
4.9/5 (34)
The following table gives the number of people living in a town years after 1990 .
 Use a calculator program to find the linear regression line for this data.
(Short Answer)
4.8/5 (35)
Filters
- Essay(0)
- Multiple Choice(0)
- Short Answer(0)
- True False(0)
- Matching(0)