Exam 2: Basic Descriptive Statistics: Percentages, Ratios and Rates, Tables, Charts, and Graphs
Exam 1: Introduction29 Questions
Exam 2: Basic Descriptive Statistics: Percentages, Ratios and Rates, Tables, Charts, and Graphs34 Questions
Exam 3: Measures of Central Tendency and Dispersion58 Questions
Exam 4: The Normal Curve28 Questions
Exam 5: Introduction to Inferential Statistics: Sampling and the Sampling Distribution34 Questions
Exam 6: Estimation Procedures for Sample Means and Proportions29 Questions
Exam 7: Hypothesis Testing With Nominal and Ordinal Variables: CHI Square31 Questions
Exam 8: Measures of Association for Variables Measured at the Nominal Level43 Questions
Exam 9: Measures of Association for Variables Measured at the Ordinal Level30 Questions
Exam 10: Hypothesis Testing With Means and Proportions: The One-Sample Case37 Questions
Exam 11: Hypothesis Testing With Means and Proportions: The Two-Sample Case31 Questions
Exam 12: Hypothesis Testing With More Than Two Means: One-Way Analysis of Variance30 Questions
Exam 13: Hypothesis Testing and Measures of Association for Variables Measured at the Interval-Ratio Level36 Questions
Exam 14: Partial Correlation and Multiple Regression and Correlation32 Questions
Select questions type
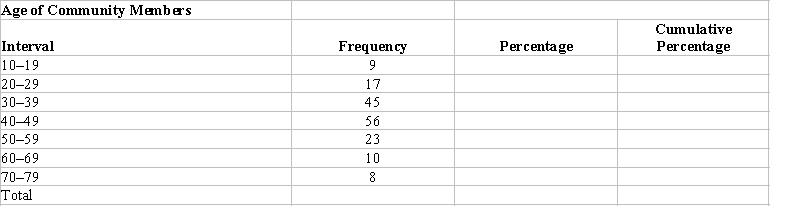
The frequency distribution below displays the distribution of age for a sample drawn from a community. Finish the table by completing the columns for percentages and cumulative percentages.
(Essay)
4.9/5  (46)
(46)
Table 2.2 Number of Prior Convictions among Inmates at a Prison
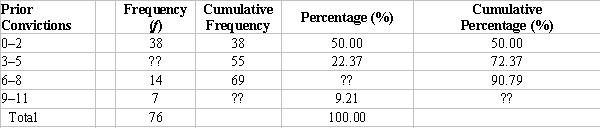 -In Table 2.2, fill in the missing value in the cumulative frequency column.
(Multiple Choice)
4.9/5 (31)
What type of data is used with histograms and frequency polygons?
(Multiple Choice)
4.8/5 (31)
What percentage value corresponds to a ratio of f1/f2 = 120/120?
(Multiple Choice)
4.8/5 (40)
Which of the following explains how to determine the ratio of smokers to non-smokers in a population?
(Multiple Choice)
4.7/5 (38)
In a sample of 2000 Manitoba adults, 80 are currently out of work. What is the correct ratio of working to non-working adults in this sample?
(Multiple Choice)
4.9/5 (41)
City A, with a population of 1,567 people, had 34 auto thefts last year. City B, with a population of 34,567, had 40 auto thefts in the same time period. City C, with a population of 156,980, had 70 auto thefts. City D, with a population of 900,880, had 305 auto thefts. Which city had the highest rate of auto thefts?
(Multiple Choice)
4.8/5 (36)
Which of the following is preferred for reporting when working with a very small number of cases?
(Multiple Choice)
4.7/5 (42)
Table 2.2 Number of Prior Convictions among Inmates at a Prison
-In Table 2.2, what is the ratio of people with 0-2 prior convictions to those with 9-11?
(Multiple Choice)
4.8/5 (31)
The following is a frequency distribution for occupational category among people in an apartment building: Professional/Executive-17; Sales/Retail-31; Manual-11; Unemployed/Retired-5. What should be the proportion of the pie allocated to Sales/Retail in a pie chart?
(Multiple Choice)
4.9/5 (34)
What is the sum of the proportions for all categories of a variable?
(Multiple Choice)
4.8/5 (40)
Table 2.2 Number of Prior Convictions among Inmates at a Prison
-In Table 2.2, what is the frequency value corresponding to the 3-5 prior conviction group?
(Multiple Choice)
4.9/5 (41)
Suppose a city experiences 75 suicides in a year, and its population is 250,000. What is the correct way to calculate its suicide rate?
(Multiple Choice)
4.9/5 (35)
Filters
- Essay(0)
- Multiple Choice(0)
- Short Answer(0)
- True False(0)
- Matching(0)