Exam 7: Demand Estimation and Forecasting
Exam 1: Managers, Profits, and Markets25 Questions
Exam 2: Demand, Supply, and Market Equilibrium52 Questions
Exam 3: Marginal Analysis for Optimal Decision Making25 Questions
Exam 4: Basic Estimation Techniques50 Questions
Exam 5: Theory of Consumer Behavior52 Questions
Exam 6: Elasticity and Demand47 Questions
Exam 7: Demand Estimation and Forecasting66 Questions
Exam 8: Production and Cost in the Short Run33 Questions
Exam 9: Production and Cost in the Long Run52 Questions
Exam 10: Production and Cost Estimation53 Questions
Exam 11: Managerial Decisions in Competitive Markets58 Questions
Exam 12: Managerial Decisions for Firms With Market Power68 Questions
Exam 13: Strategic Decision Making in Oligopoly Markets54 Questions
Exam 14: Advanced Techniques for Profit Maximization67 Questions
Exam 15: Decisions Under Risk and Uncertainty35 Questions
Exam 16: Government Regulation of Business29 Questions
Select questions type
refer to the following:
The estimated demand for a good is
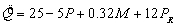 where Q is the quantity demanded of the good, P is the price of the good, M is income, and
  is the price of related good R.
-The coefficient on P
is the price of related good R.
-The coefficient on P
(Multiple Choice)
4.7/5  (35)
(35)
The empirical demand function is estimated in log-linear form as  where
where  is the estimated number of units of good X demanded, P is the price of X, M is income, and
  is the price of related good Y. (All parameters estimates are significantly different from zero at the 5 percent level.)
-Calculate the following elasticities:
(1) Price elasticity:
is the price of related good Y. (All parameters estimates are significantly different from zero at the 5 percent level.)
-Calculate the following elasticities:
(1) Price elasticity:  = __________.
(2) Cross-price elasticity:
= __________.
(2) Cross-price elasticity:  = __________.
(3) Income elasticity:
= __________.
(3) Income elasticity:  = __________.
(Short Answer)
4.8/5 (35)
refer to the following:
The following linear demand specification is estimated for Conlan Enterprises, a price-setting firm:
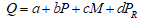 where Q is the quantity demanded of the product Conlan Enterprises sells, P is the price of that product, M is income, and PR is the price of a related product. The results of the estimation are presented below:
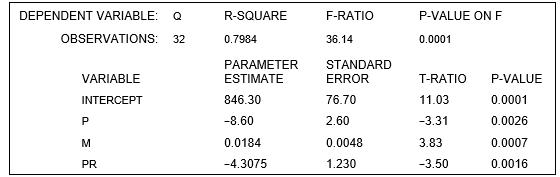 -At the 1% level of significance, which estimates are statistically significant?
(Multiple Choice)
4.8/5 (38)
The estimated market demand for good X is 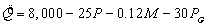 where
where  is the estimated number of units of good X demanded, P is the price of the good, M is income, and
  is the price of related good G. (All parameter estimates are statistically significant at the 1 percent level of significance.)
-At P = $12, M = $30,000, and pG = $50, the predicted quantity demanded is _________ units of good X.
is the price of related good G. (All parameter estimates are statistically significant at the 1 percent level of significance.)
-At P = $12, M = $30,000, and pG = $50, the predicted quantity demanded is _________ units of good X.
(Short Answer)
4.9/5 (42)
The estimated market demand for good X is where is the estimated number of units of good X demanded, P is the price of the good, M is income, and is the price of related good G. (All parameter estimates are statistically significant at the 1 percent level of significance.)
-At the values in part b, calculate estimates of the following elasticities:
(1) Price elasticity:  = _________.
(2) Cross-price elasticity:
= _________.
(2) Cross-price elasticity:  = __________.
(3) Income elasticity:
= __________.
(3) Income elasticity:  = __________.
(Short Answer)
4.8/5 (38)
Border Snacks Inc. produces and sells picante sauce, nacho chips, and queso dip. The company's marketing department estimated a linear demand function for Border's picante sauce: 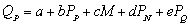 where
where  is the number of jars of picante sauce sold per month,
  is the price of picante sauce,
  is the price of a bag of nacho chips,
  is the price of a jar of queso dip, and M is consumer income. In the market served by Border Snacks, income is currently $16,000. The following regression results were obtained using 22 monthly observations:
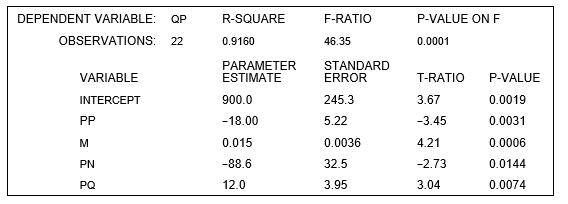 -If Border Snacks Inc. sets the price of picante at $6 per jar, the price of its nacho chips at $3 per bag, and the price of its queso dip at $8 per jar, sales of picante sauce is forecast to be ________________ jars per month. Show your work below:
(Short Answer)
4.8/5 (47)
You decide to estimate the following quarterly sales forecasting model for new boat sales in your local county:
 The equation is estimated using quarterly data on new boat sales in the county from 2001III -2007IV ( t = 1,..., 26). The variable D is a dummy variable for the second quarter, which is the "season" for selling new boats: D = 1 in the second quarter, and 0 otherwise. The results of the estimation are:
 -The forecasted sales for the 2nd quarter of 2008 are ___________ units.
(Short Answer)
4.8/5 (37)
refer to the following:
The following linear demand specification is estimated for Conlan Enterprises, a price-setting firm:
where Q is the quantity demanded of the product Conlan Enterprises sells, P is the price of that product, M is income, and PR is the price of a related product. The results of the estimation are presented below:
-At the 1% level of significance, the critical value of the F-statistic is equal to __________.
(Multiple Choice)
4.7/5 (45)
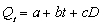
A linear trend equation for sales of the form  was estimated using annual sales data for the period 2000 - 2007 (i.e., t = 2000, 2001, ..., 2007). The results of the regression are as follows:
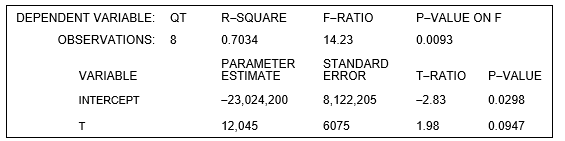 -In the year 2009, sales are forecasted to be ___________ units.
(Short Answer)
4.8/5 (27)
refer to the following:
The manufacturer of Beanie Baby dolls used quarterly price data for 2002I - 2010IV (t = 1, ..., 36) and the regression equation
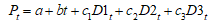 to forecast doll prices in the year 2011. Pt is the quarterly price of dolls, and D1t , D2t and D3t are dummy variables for quarters I, II, and III, respectively.
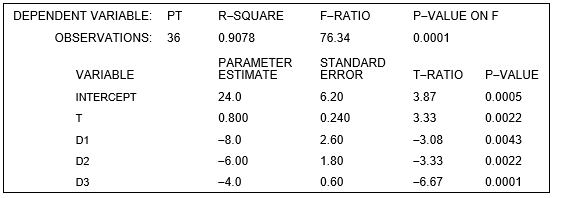 -At the 2 percent level of statistical significance, is there a statistically significant trend in the price of dolls?
(Multiple Choice)
4.8/5 (28)
A forecaster used the following regression equation 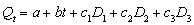 and quarterly sales data during 1999II - 2007IV (t = 1, ..., 35) for an appliance manufacturer to obtain the estimation results shown below. Q is quarterly sales, and
  ,and
,and  are seasonal dummy variables for quarters I, II, and III.
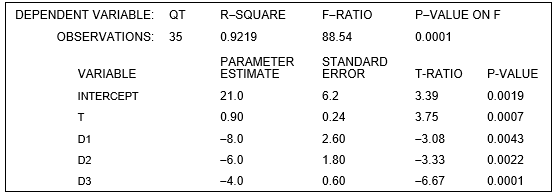 -At the 2 percent level of significance, the critical value of the t-statistic is _______.
The parameter estimate of a ________ (is, is not) statistically significant.
The parameter estimate of b ________ (is, is not) statistically significant.
The parameter estimate of C1 ________ (is, is not) statistically significant.
The parameter estimate of C2 ________ (is, is not) statistically significant.
The parameter estimate of C3 ________ (is, is not) statistically significant.
-At the 2 percent level of significance, the critical value of the t-statistic is _______.
The parameter estimate of a ________ (is, is not) statistically significant.
The parameter estimate of b ________ (is, is not) statistically significant.
The parameter estimate of C1 ________ (is, is not) statistically significant.
The parameter estimate of C2 ________ (is, is not) statistically significant.
The parameter estimate of C3 ________ (is, is not) statistically significant.
(Short Answer)
4.8/5 (41)
refer to the following:
The manufacturer of Beanie Baby dolls used quarterly price data for 2002I - 2010IV (t = 1, ..., 36) and the regression equation
to forecast doll prices in the year 2011. Pt is the quarterly price of dolls, and D1t , D2t and D3t are dummy variables for quarters I, II, and III, respectively.
-What is the estimated intercept of the trend line in the 4th quarter?
(Multiple Choice)
4.8/5 (36)
refer to the following:
The estimated demand for a good is
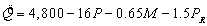 where Q is the quantity demanded of the good, P is the price of the good, M is income, and
  is the price of related good R.
-The coefficient on P
is the price of related good R.
-The coefficient on P
(Multiple Choice)
4.7/5 (39)
refer to the following:
A forecaster used the regression equation
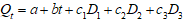 and quarterly sales data for 1993I-2010IV (t = 1, ..., 64) for an appliance manufacturer to obtain the results shown below. Q is quarterly sales, and D1, D2and D3are dummy variables for quarters I, II, and III.
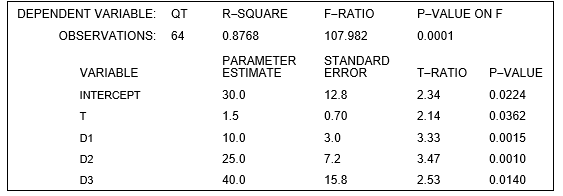 -Using the estimation results given above, the predicted level of sales in 2011I is _______ units.
(Multiple Choice)
4.9/5 (44)
The following log-linear demand curve for a price-setting firm is estimated using the ordinary least-squares method:
 The estimation results are presented below:
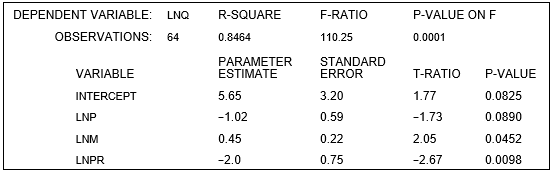 -A 22 percent decrease in household income, holding all other things constant, will cause quantity demanded to _____________ (increase, decrease) by _____ percent.
(Short Answer)
4.8/5 (38)
The following log-linear demand curve for a price-setting firm is estimated using the ordinary least-squares method:
The estimation results are presented below:
-The estimated demand equation can be expressed in logarithms as ln  = ___________.
(Short Answer)
4.8/5 (38)
refer to the following:
A forecaster used the regression equation
and quarterly sales data for 1993I-2010IV (t = 1, ..., 64) for an appliance manufacturer to obtain the results shown below. Q is quarterly sales, and D1, D2and D3are dummy variables for quarters I, II, and III.
-What is the estimated intercept of the trend line in the second quarter?
(Multiple Choice)
4.8/5 (45)
refer to the following:
A consulting firm estimates the following quarterly sales forecasting model:
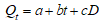 The equation is estimated using quarterly data from 2000I-2010III (t = 1,..., 43). The variable D is a dummy variable for the second quarter where:
D = 1 in the second quarter, and 0 otherwise.
The results of the estimation are:
The equation is estimated using quarterly data from 2000I-2010III (t = 1,..., 43). The variable D is a dummy variable for the second quarter where:
D = 1 in the second quarter, and 0 otherwise.
The results of the estimation are:
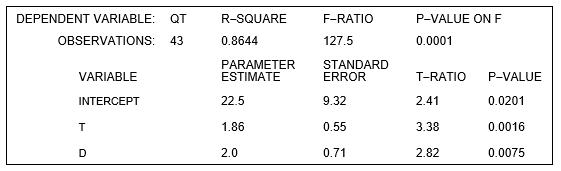 -What is the estimated intercept of the trend line in the third quarter?
(Multiple Choice)
4.9/5 (37)
refer to the following:
A consulting firm estimates the following quarterly sales forecasting model:
The equation is estimated using quarterly data from 2000I-2010III (t = 1,..., 43). The variable D is a dummy variable for the second quarter where:
D = 1 in the second quarter, and 0 otherwise.
The results of the estimation are:
-Using the estimated trend line, what is the predicted level of sales in 2010IV ?
(Multiple Choice)
4.9/5 (36)
You decide to estimate the following quarterly sales forecasting model for new boat sales in your local county:
The equation is estimated using quarterly data on new boat sales in the county from 2001III -2007IV ( t = 1,..., 26). The variable D is a dummy variable for the second quarter, which is the "season" for selling new boats: D = 1 in the second quarter, and 0 otherwise. The results of the estimation are:
-At the 1 percent level of significance, the critical value of the t-statistic is _______. The parameter estimate of a ________ (is, is not) statistically significant. The parameter estimate of b ________ (is, is not) statistically significant. The parameter estimate of c ________ (is, is not) statistically significant.
(Short Answer)
4.8/5 (33)
Filters
- Essay(0)
- Multiple Choice(0)
- Short Answer(0)
- True False(0)
- Matching(0)