Exam 7: Demand Estimation and Forecasting
Exam 1: Managers, Profits, and Markets25 Questions
Exam 2: Demand, Supply, and Market Equilibrium52 Questions
Exam 3: Marginal Analysis for Optimal Decision Making25 Questions
Exam 4: Basic Estimation Techniques50 Questions
Exam 5: Theory of Consumer Behavior52 Questions
Exam 6: Elasticity and Demand47 Questions
Exam 7: Demand Estimation and Forecasting66 Questions
Exam 8: Production and Cost in the Short Run33 Questions
Exam 9: Production and Cost in the Long Run52 Questions
Exam 10: Production and Cost Estimation53 Questions
Exam 11: Managerial Decisions in Competitive Markets58 Questions
Exam 12: Managerial Decisions for Firms With Market Power68 Questions
Exam 13: Strategic Decision Making in Oligopoly Markets54 Questions
Exam 14: Advanced Techniques for Profit Maximization67 Questions
Exam 15: Decisions Under Risk and Uncertainty35 Questions
Exam 16: Government Regulation of Business29 Questions
Select questions type
refer to the following:
The manufacturer of Beanie Baby dolls used quarterly price data for 2002I - 2010IV (t = 1, ..., 36) and the regression equation
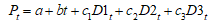 to forecast doll prices in the year 2011. Pt is the quarterly price of dolls, and D1t , D2t and D3t are dummy variables for quarters I, II, and III, respectively.
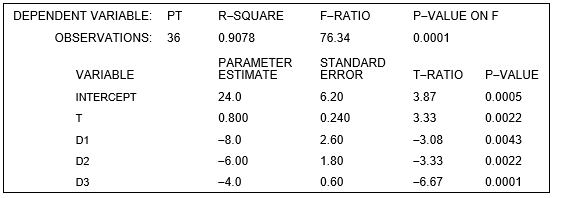 -Using the estimated time-series regression, predicted price in the 2nd quarter of 2011 is
(Multiple Choice)
5.0/5  (34)
(34)
refer to the following:
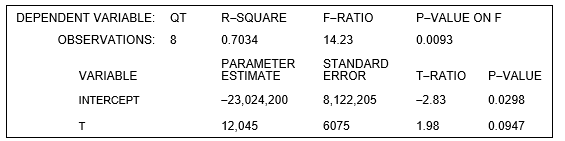
A forecaster used the regression equation
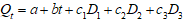 and quarterly sales data for 1993I-2010IV (t = 1, ..., 64) for an appliance manufacturer to obtain the results shown below. Q is quarterly sales, and D1, D2and D3are dummy variables for quarters I, II, and III.
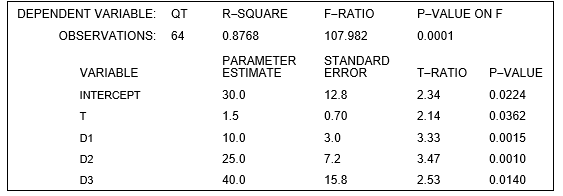 -Using the estimation results given above, the predicted level of sales in 2011III is _______ units.
(Multiple Choice)
4.9/5 (42)
refer to the following:
The estimated demand for a good is
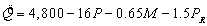 where Q is the quantity demanded of the good, P is the price of the good, M is income, and
  is the price of related good R.
-The good is
is the price of related good R.
-The good is
(Multiple Choice)
4.8/5 (38)
refer to the following:
A forecaster used the regression equation
and quarterly sales data for 1993I-2010IV (t = 1, ..., 64) for an appliance manufacturer to obtain the results shown below. Q is quarterly sales, and D1, D2and D3are dummy variables for quarters I, II, and III.
-Using the estimation results given above, the predicted level of sales in 2011IV is _______ units.
(Multiple Choice)
4.8/5 (35)
A linear trend equation for sales of the form  was estimated using annual sales data for the period 2000 - 2007 (i.e., t = 2000, 2001, ..., 2007). The results of the regression are as follows:
 -In the year 2008, sales are forecasted to be ___________ units.
(Short Answer)
4.7/5 (38)
suppose income remains at $10,000 but the price of the related good increases to $60 and Conlan decides to raise the price of its product to $50.
-What is the new own price elasticity of demand?
(Multiple Choice)
4.8/5 (35)
Filters
- Essay(0)
- Multiple Choice(0)
- Short Answer(0)
- True False(0)
- Matching(0)