Exam 6: Elasticity and Demand
Exam 1: Managers, Profits, and Markets25 Questions
Exam 2: Demand, Supply, and Market Equilibrium52 Questions
Exam 3: Marginal Analysis for Optimal Decision Making25 Questions
Exam 4: Basic Estimation Techniques50 Questions
Exam 5: Theory of Consumer Behavior52 Questions
Exam 6: Elasticity and Demand47 Questions
Exam 7: Demand Estimation and Forecasting66 Questions
Exam 8: Production and Cost in the Short Run33 Questions
Exam 9: Production and Cost in the Long Run52 Questions
Exam 10: Production and Cost Estimation53 Questions
Exam 11: Managerial Decisions in Competitive Markets58 Questions
Exam 12: Managerial Decisions for Firms With Market Power68 Questions
Exam 13: Strategic Decision Making in Oligopoly Markets54 Questions
Exam 14: Advanced Techniques for Profit Maximization67 Questions
Exam 15: Decisions Under Risk and Uncertainty35 Questions
Exam 16: Government Regulation of Business29 Questions
Select questions type
refer to the following figure:
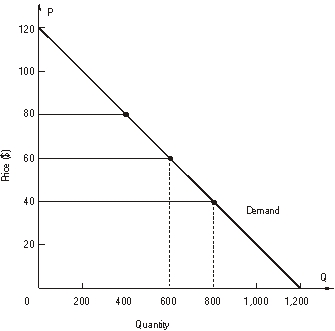 -What is demand elasticity over the price range $40 to $60?
(Multiple Choice)
4.7/5  (35)
(35)
Fill in the blanks.
-When demand is unitary elastic, an increase in price causes quantity demanded to _________________ and total revenue to ___________________.
(Short Answer)
4.9/5 (31)
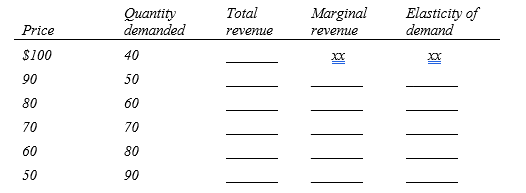
Using the following demand schedule, calculate total revenue, marginal revenue, and price elasticity of demand. Then show the relation among marginal revenue, price, and elasticity of demand.
(Essay)
5.0/5 (43)
The price elasticity of demand for a firm's product is -2.25 over the range of prices being considered by the firm's manager.
-If the manager wishes to increase sales by 25 percent, the manager predicts the price of the product must be _____________ by _______ percent.
(Short Answer)
4.8/5 (37)
Boeing estimates the elasticity of demand for new commercial jets is -1.25. Explain why the following statements are either true or false (i.e., state whether true or false and explain why.)
-"The price effect dominates the quantity effect."
(True/False)
4.8/5 (38)
If the price elasticity of DVD recorders is -0.3 and price increases 20%, what happens to the quantity of DVD recorders demanded?
(Multiple Choice)
4.9/5 (46)
Use the graph below to answer the following questions:
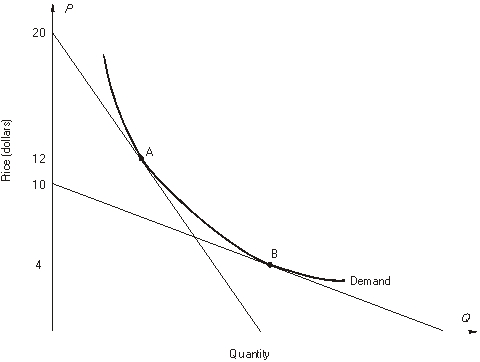 -At point B, if price decreases by a small amount, total revenue _____________ (rises, falls, remains constant), and marginal revenue is _______________ (positive, negative, zero).
(Short Answer)
4.8/5 (35)
Use the figure below to answer the following questions:
 -The elasticity of demand over the price interval $5 to $3 is __________.
(Short Answer)
4.8/5 (33)
In the graph shown below, the demand for good X shifts due to a change in the price of a related good Y. Holding the price of good X constant at $200, answer the following questions:
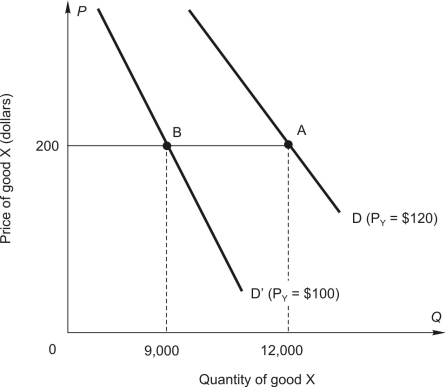 -Goods X and Y are ________________.
(Short Answer)
4.8/5 (36)
Fill in the blanks.
-When demand is elastic, a decrease in price causes quantity demanded to ___________ and total revenue to ________.
(Short Answer)
4.9/5 (37)
In the graph shown below, the demand for good X shifts due to a change in income. Holding the price of good X constant at $200, answer the following questions:
 -Good X is a ____________good.
(Short Answer)
4.8/5 (46)
Use the graph below to answer the following questions:
-At point A, if price increases by a small amount, total revenue _____________ (rises, falls, remains constant), and marginal revenue is __________________ (positive, negative, zero).
(Short Answer)
4.9/5 (30)
Use the linear demand curve shown below to answer the following questions.
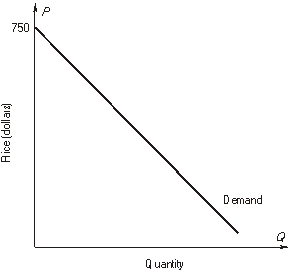 The point elasticity of demand at a price of $650 is _________.
-As price falls, |E| __________________ (gets larger, gets smaller, stays the same) for a linear demand curve.
The point elasticity of demand at a price of $650 is _________.
-As price falls, |E| __________________ (gets larger, gets smaller, stays the same) for a linear demand curve.
(Short Answer)
4.9/5 (35)
Fill in the blanks.
-If price rises and total revenue rises, demand must be _____________________.
(Short Answer)
5.0/5 (37)
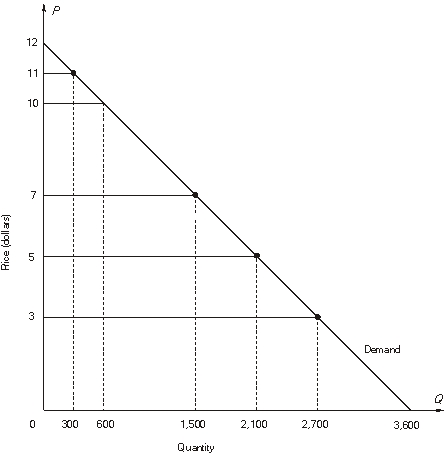
Use the figure below to answer the following questions:
-The elasticity of demand over the price interval $11 to $10 is __________.
(Short Answer)
4.8/5 (32)
Fill in the blanks.
-If price falls and total revenue rises, demand must be _____________________.
(Short Answer)
4.8/5 (40)
Fill in the blanks.
-When demand is elastic, the __________ effect dominates the __________ effect.
(Short Answer)
4.7/5 (42)
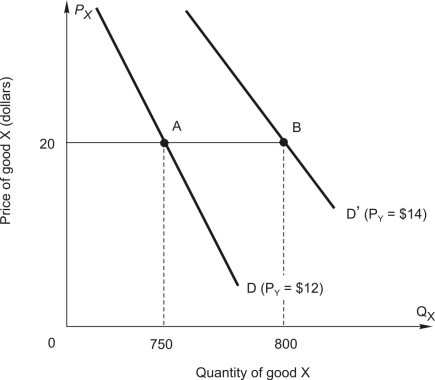
Use the figure below to calculate the cross-price elasticity of demand for good X when the price of good Y increases from $12 to $14:
(Multiple Choice)
4.8/5 (29)
Use the graph below to answer the following questions:
-The elasticity of demand at a price of $4 is _________.
(Short Answer)
4.7/5 (35)
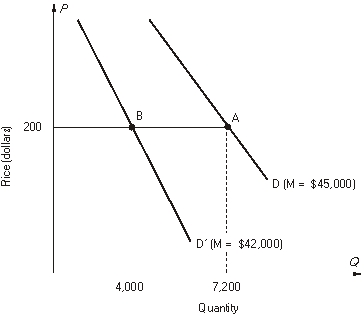
In the graph shown below, the demand for good X shifts due to a change in income. Holding the price of good X constant at $200, answer the following questions:
-The graph shows how the demand
for X shifts when income decreases from $45,000 to $42,000. Using the information in the graph, the income elasticity of demand for X is calculated to be _________.
(Short Answer)
4.9/5 (34)
Filters
- Essay(0)
- Multiple Choice(0)
- Short Answer(0)
- True False(0)
- Matching(0)