Exam 10: Correlation and Regression
Exam 1: Concepts, Variables, and Measurement37 Questions
Exam 2: Frequency Tables32 Questions
Exam 3: Measures of Central Tendency39 Questions
Exam 4: Measures of Dispersion29 Questions
Exam 5: Probability and the Normal Curve29 Questions
Exam 6: Probabilityfrom Samples to Statistics31 Questions
Exam 7: Cross-Tabulation Tables and Chi-Square27 Questions
Exam 8: Measures of Association for Categorical Variables37 Questions
Exam 9: Analysis of Variance27 Questions
Exam 10: Correlation and Regression28 Questions
Select questions type
In the linear regression equation, Y=a+bx, "a" represents -----------.
(Multiple Choice)
5.0/5  (39)
(39)
Based on the equation in question 4, where does the regression line cross the y-axis?
(Multiple Choice)
4.8/5 (38)
In the linear regression equation, "b" represents the y-intercept.
(True/False)
4.9/5 (31)
Use the table below to answer the following questions:
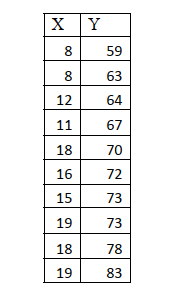 a.Calculate the slope and the y-intercept for the regression line for the distribution. Writethe regression line.
Slope:
Y-intercept:
Regression line:
b.Interpret the numbers of both the slope and the y-intercept.
c.Compute r and r2 for the regression equation.
d. Interpret both the r and r2 . What does each number tell us?
a.Calculate the slope and the y-intercept for the regression line for the distribution. Writethe regression line.
Slope:
Y-intercept:
Regression line:
b.Interpret the numbers of both the slope and the y-intercept.
c.Compute r and r2 for the regression equation.
d. Interpret both the r and r2 . What does each number tell us?
(Essay)
4.9/5 (28)
Use the data below to answer the following questions:
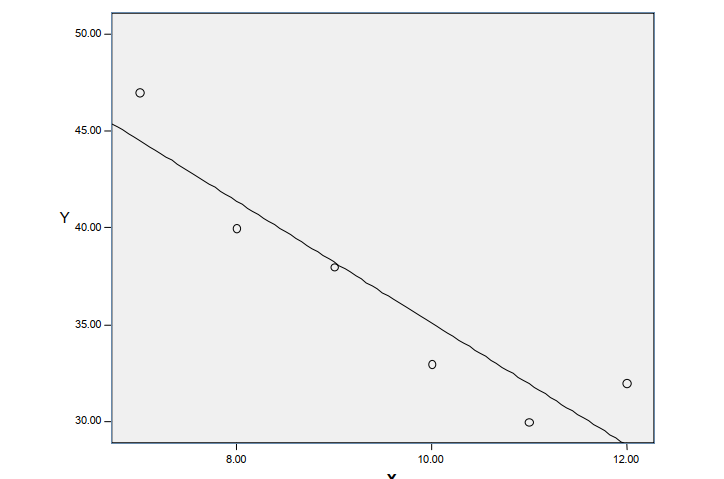
a. Create a scatterplot using the data below.
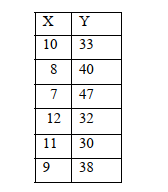 b. Calculate the slope and the y-intercept for the regression line for the distribution. Write the regression line equation.
Slope:
Y-intercept:
Regression line:
b. Calculate the slope and the y-intercept for the regression line for the distribution. Write the regression line equation.
Slope:
Y-intercept:
Regression line:
 c.Interpret the numbers of boththe slope and the y-intercept.
d.Compute r and 2 for the regression equation.
e. Interpret both the r and 2 What does each number tell us?
c.Interpret the numbers of boththe slope and the y-intercept.
d.Compute r and 2 for the regression equation.
e. Interpret both the r and 2 What does each number tell us?
(Essay)
4.8/5 (27)
Based on the equation in question 1, where does the regression line cross the y-axis?
(Multiple Choice)
4.7/5 (29)
Use the data below to answer questions:
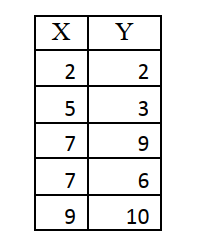 -How many degrees of freedom exist in the data?
(Multiple Choice)
4.9/5 (38)
Filters
- Essay(0)
- Multiple Choice(0)
- Short Answer(0)
- True False(0)
- Matching(0)