Exam 18: Nonparametric Tests
Exam 1: Introduction37 Questions
Exam 2: Summarizing Data: Listing and Grouping63 Questions
Exam 3: Summarizing Data: Measures of Location57 Questions
Exam 4: Summarizing Data: Measures of Variation56 Questions
Exam 5: Possibilities and Probabilities63 Questions
Exam 6: Some Rules of Probability75 Questions
Exam 7: Expectations and Decisions49 Questions
Exam 8: Probability Distributions78 Questions
Exam 9: The Normal Distribution89 Questions
Exam 10: Sampling and Sampling Distributions61 Questions
Exam 11: Problems of Estimation13 Questions
Exam 12: Tests of Hypotheses: Means55 Questions
Exam 13: Tests of Hypotheses: Standard Deviations39 Questions
Exam 14: Tests of Hypotheses Based on Count Data43 Questions
Exam 15: Analysis of Variance49 Questions
Exam 16: Regression39 Questions
Exam 17: Correlation28 Questions
Exam 18: Nonparametric Tests41 Questions
Select questions type
A test was conducted to compare the miles per gallon obtained by three sub-compact automobiles. The following data (in miles per gallon) were obtained from 6 full tanks of the same gasoline.
I.
II.
III.
Use a nonparametric test to evaluate whether or not there are significant differences in gasoline economy among the automobiles. Use .
(Essay)
4.8/5  (37)
(37)
The nonparametric alternative to the one-way analysis of variance is the
(Multiple Choice)
4.9/5 (46)
An aptitude test is given to trainees on a high-tech form. Here are the grades on the test in the order that the trainees completed the test:
.
Test whether the trainees finished the test in random order with regard to grades. Use .
(Essay)
4.9/5 (40)
The nonparametric alternative to the two-sample test for the difference between two independent means is the
(Multiple Choice)
4.8/5 (45)
In the Kruskal-Wallis test, all terms involving ties are eliminated from consideration.
(True/False)
4.9/5 (35)
The following are monthly sales (in thousands of dollars) of two department stores, A and B, for the months January through December 1979:
10 and 9,7 and 4,8 and 5, 7 and 6,11 and 10,15 and 16,
15 and 13,12 and 13,9 and 8,18 and 17,19 and 13,21 and 20.
-For the situation above, use the small sample sign test with to test the null hypothesis that on the average the two department stores have equal sales against the alternative that on the average
a. department store has more sales.
b. there is a difference in sales between the two stores.
(Essay)
4.8/5 (33)
The approximation should only be used in the test if each sample has more than five items.
(True/False)
4.9/5 (47)
Random samples of 15 Model I cars and 13 Model II cars were obtained and the number of miles (in thousands) that each lasted from new until the car was "junked" was recorded.
Model I:
Model II:
Test the null hypothesis that the two models have the same average life expectancy against the alternative hypothesis that they do not have the same average life expectancy. Use .
(Essay)
4.9/5 (30)
A nonparametric measure of the association between two variables is called the __________.
(Short Answer)
4.8/5 (36)
The null hypothesis in the runs test is that the sequence of observations is __________.
(Short Answer)
4.8/5 (33)
Suppose that the test is to be applied to the following sequence. 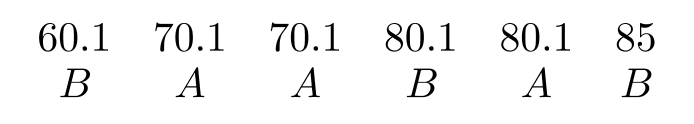 The correct rankings in order are
(Multiple Choice)
4.8/5 (39)
In a U test, the large sample statistic can be applied if __________ and __________.
(Short Answer)
4.9/5 (40)
Table 18.1
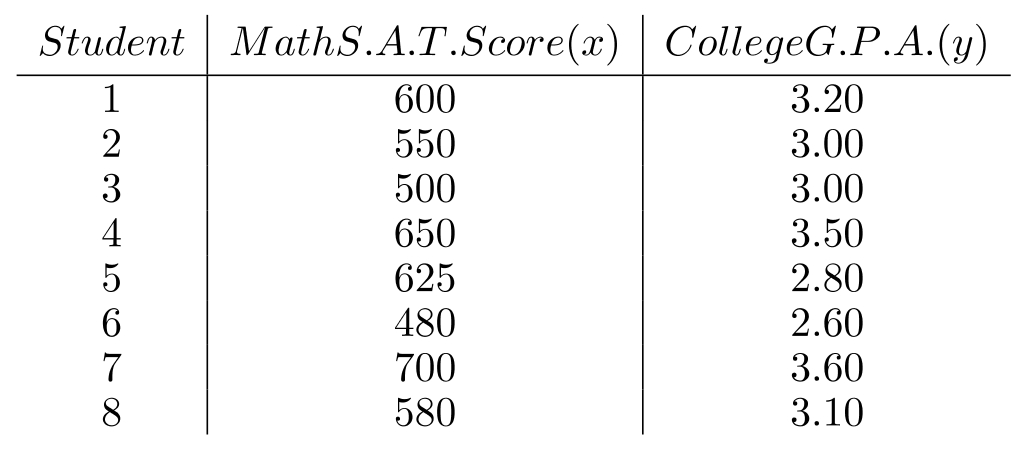 -The mathematics S.A.T. scores and college grade point averages of eight students are given in table 18.1.
a. Calculate the rank-correlation coefficient .
b. Test the null hypothesis of no correlation using . Let .
-The mathematics S.A.T. scores and college grade point averages of eight students are given in table 18.1.
a. Calculate the rank-correlation coefficient .
b. Test the null hypothesis of no correlation using . Let .
(Essay)
4.8/5 (43)
The application of the test requires that the two independent samples have the same sample size.
(True/False)
5.0/5 (43)
Table 18.3
A consumer advocate is interested in testing whether the number of french fries in a portion in a particular cafeteria is different from that of a particular restaurant. The table below shows the results when random samples of 10 portions of french fries are selected and fries counted.
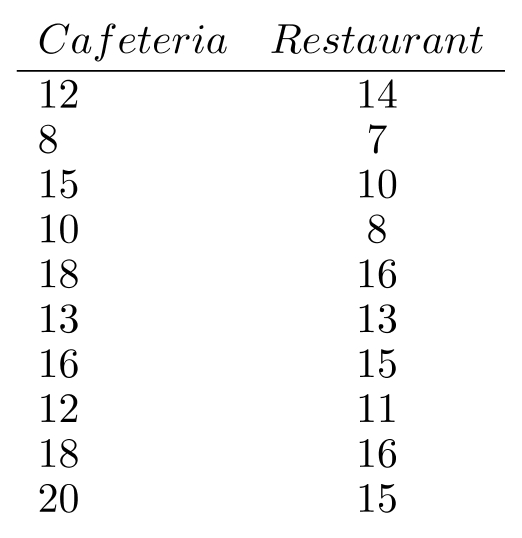 -Use Table 18.3 to conduct the test using .
(Essay)
4.7/5 (38)
The use of test requires the assumption that the independent random samples come from identical populations.
(True/False)
4.8/5 (35)
In a one-sample sign test, the null hypothesis can be written as __________ or __________.
(Short Answer)
4.8/5 (39)
When we are comparing two populations and our two samples are such that each element of one sample relates to a particular element of the other sample, an appropriate nonparametric test would be the
(Multiple Choice)
4.9/5 (43)
In applying the number of runs test to the sequence , the value of is __________.
(Short Answer)
4.8/5 (38)
Filters
- Essay(0)
- Multiple Choice(0)
- Short Answer(0)
- True False(0)
- Matching(0)