Exam 2: Summarizing Data
Exam 1: Collecting Data and Drawing Conclusions60 Questions
Exam 2: Summarizing Data55 Questions
Exam 3: Randomness in Data61 Questions
Exam 4: Inference From Data: Principles57 Questions
Exam 5: Inference From Data: Comparisons22 Questions
Exam 6: Inferences With Categorical Data32 Questions
Exam 7: Relationships in Data35 Questions
Exam 8: Analyzing Probabilities and Expected Values34 Questions
Select questions type
Is the mean absolute deviation more or less resistant to outliers than the standard deviation? Explain briefly.
(Essay)
4.8/5  (43)
(43)
In a study reported in the July 2007 issue of the Journal of Epidemiology and Community Health, researchers investigated whether veterans are more likely to commit suicide than nonveterans. They spent 12 years following 104,000 veterans who had served in the armed forces between 1917 and 1994, and compared them with 216,000 nonveterans. They found that 197 veterans and 311 nonveterans committed suicide.
-Identify the explanatory and response variables in this study.
(Short Answer)
4.9/5 (43)
Create an example of five hypothetical exam scores (between 0 and 100 , with repeats allowed) with the property that the mean is greater than three times the median.
(Short Answer)
4.8/5 (44)
The following histograms display the distributions of percentage of a state's residents who are Mexican, for each region of the country (West, South, Northeast, Midwest). 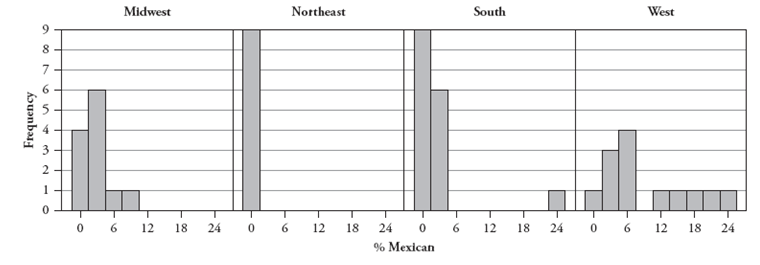 -Which of these three sets of numbers (above) has the largest standard deviation? Explain your reasoning, but do not do any calculations.
(Essay)
4.8/5 (30)
The 2001_2002 National Health and Nutrition Examination Survey asked people over the age of 60 how many close friends they had. The answers for the 1840 respondents appear in the following table. (For example, 82 people answered that they have 0 close friends, and 13 people answered that they have 50 close friends, and nobody answered that they have 18 close friends.)
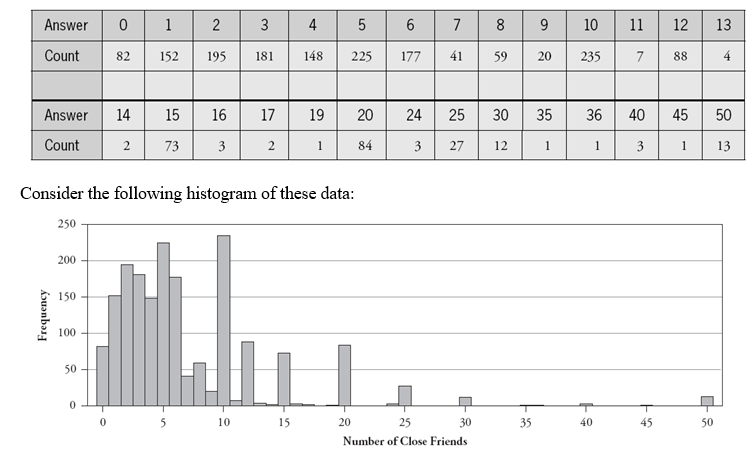 a. Write a paragraph describing key features of this distribution.
b. Determine the median of these data.
c. Would you expect the mean to be greater than the median, less than the median, or about the same as the median? Explain briefly without calculating the mean.
a. Write a paragraph describing key features of this distribution.
b. Determine the median of these data.
c. Would you expect the mean to be greater than the median, less than the median, or about the same as the median? Explain briefly without calculating the mean.
(Short Answer)
4.7/5 (33)
The following histograms display the distributions of percentage of a state's residents who are Mexican, for each region of the country (West, South, Northeast, Midwest).
-Which region do you suspect has the largest standard deviation in percentages? Explain.
(Essay)
4.7/5 (36)
a. Construct a hypothetical example of ten exam scores (between 0 and 100 , inclusive, possibly including repeats) so that the mean is greater than two times the median. Also report the values of the mean and median for your example.
b. Construct another (or different) hypothetical example of ten exam scores (between 0 and 100, inclusive, possibly including repeats) so that the interquartile range equals 50. Also report the values of the quartiles for your example.
(Short Answer)
4.9/5 (26)
Is it better to praise a child's intelligence or effort? In a study reported in a 1998 issue of the Journal of Personality and Social Psychology, researchers investigated this question by randomly assigning fifthgraders into three groups. One group received praise for their intelligence after working on a set of problems; another group received praise for their effort; and a third (control) group received general praise that did not mention a specific attribute. Each child was then asked to write a description of the problems for a child in another state, including how many he or she solved correctly. One response variable was whether the child lied about how many problems he/she had solved correctly. The data are organized in the following table: 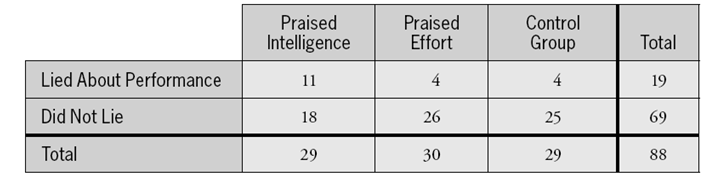 -Analyze these data to investigate whether they suggest any relationship between the type of praise given to a child and the child's propensity for lying about performance. Write a paragraph describing your findings, and support your findings with a graphical display and calculations.
(Short Answer)
4.9/5 (37)
The following table reports counts of the number of "close friends" reported by a sample of men and a sample of women: 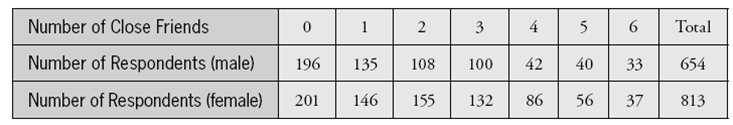 -Based on the shape of the distributions, do you expect the means to be greater than the medians, less than the medians, or very close to the medians? (Do not calculate either mean.)
(Short Answer)
4.9/5 (41)
The following histograms display the distributions of percentage of a state's residents who are Mexican, for each region of the country (West, South, Northeast, Midwest).
-Which of the following sets of five numbers has the smallest standard deviation? Explain your reasoning, but do not do any calculations.
(a)
(b)
(c)
(Essay)
4.8/5 (38)
The following dotplot displays the salaries of the 23 presidents of California State University campuses for the 2007\_08 academic year:
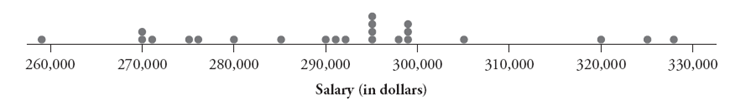 These salaries, arranged in order, are listed here:
258,680 270,000 270,315 270,568 275,000 276,055 279,500 285,000 290,000 291,179 292,000 295,000 295,000 295,000 295,000 297,870 298,749 299,000 299,435 305,008 320,329 325,000 328,209
a. Determine the five-number summary of these salaries. Consider the following computer output:
Variable N Mean StDev salary 23 291,822 17,669
b. The salary for Cal Poly's President Baker is . Calculate the -score for his salary, and decide whether his salary is more than two standard deviations above the mean.
c. Check whether President Baker's salary is an outlier, according to the 1.5 _ IQR rule.
These salaries, arranged in order, are listed here:
258,680 270,000 270,315 270,568 275,000 276,055 279,500 285,000 290,000 291,179 292,000 295,000 295,000 295,000 295,000 297,870 298,749 299,000 299,435 305,008 320,329 325,000 328,209
a. Determine the five-number summary of these salaries. Consider the following computer output:
Variable N Mean StDev salary 23 291,822 17,669
b. The salary for Cal Poly's President Baker is . Calculate the -score for his salary, and decide whether his salary is more than two standard deviations above the mean.
c. Check whether President Baker's salary is an outlier, according to the 1.5 _ IQR rule.
(Short Answer)
4.8/5 (37)
The following data are monthly rents (in dollars) of studio and one-bedroom apartments in Harrisburg and Philadelphia, Pennsylvania.
Harrisburg
Philadelphia
-Compare and contrast the distributions of monthly apartment rents in these two cities. Refer to appropriate calculations and displays to support your comments.
(Short Answer)
4.8/5 (36)
The following side-by-side stemplot displays the total number of points scored per Super Bowl football game for the first 41 Super Bowls (from 1967-2007), separated according to the first 20 games (19671986) and the next 21 games (1987-2007): 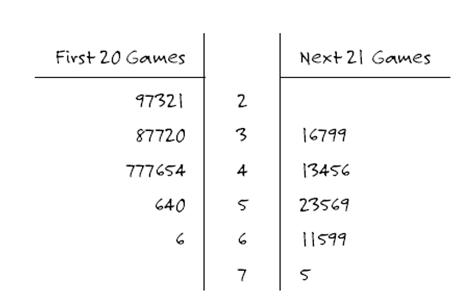 -Does this stemplot enable you to determine how many of the first 41 Super Bowls had a total of 37 points? If so, what is this number?
(Short Answer)
4.9/5 (38)
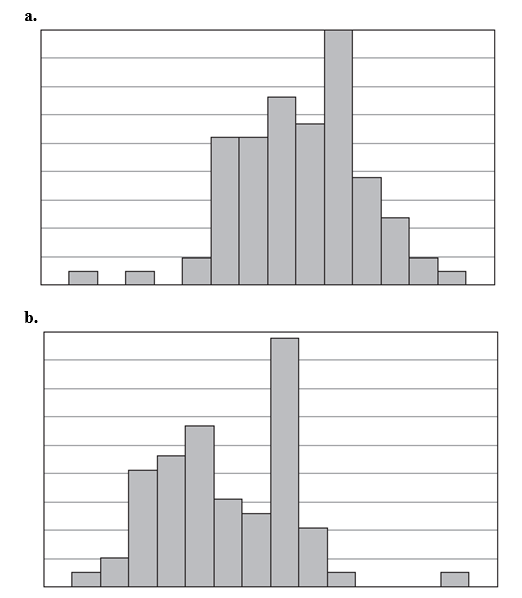
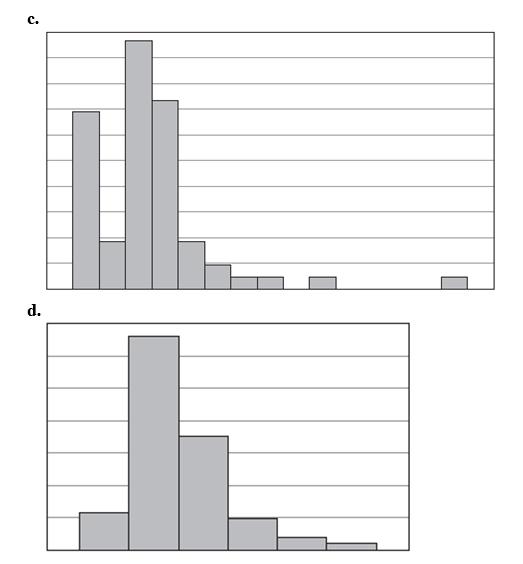
The following histogram displays the magnitudes of the 614 earthquakes with Richter scale magnitude greater than 1.0 that occurred in the United States between March 25 and April 1, 2004: 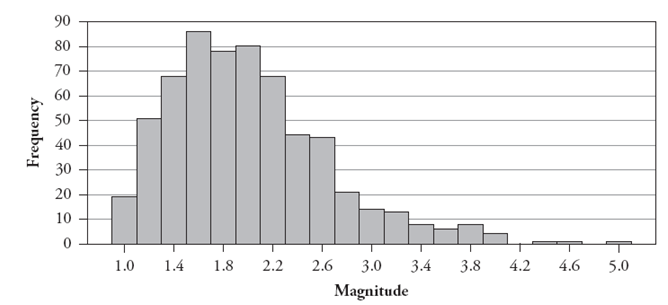 -Which histogram do you think displays the variable price paid for most recent haircut? Justify your answer.
(Essay)
4.8/5 (36)
The following data are monthly rents (in dollars) of studio and one-bedroom apartments in Harrisburg and Philadelphia, Pennsylvania.
Harrisburg
Philadelphia
-For each city, determine and report the five-number summary of these monthly rents.
(Short Answer)
4.8/5 (40)
The following table reports counts of the number of "close friends" reported by a sample of men and a sample of women:
-For each gender, calculate the proportion who say that they have no close friends. Comment on how these proportions compare between men and women.
(Short Answer)
4.9/5 (27)
Suppose a company that has recently fired many of its employees produces the following data on the gender (male/female) and job type (managerial/clerical) of the employees.
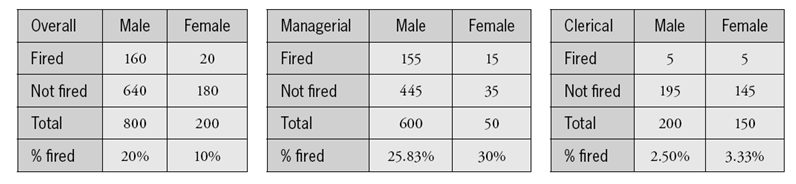 a. Show that Simpson's paradox holds for these data. (Point out the relevant percentages and the relevant inequalities, i.e., which percentages are greater than which others.)
b. Write a sentence or two explaining, as if to an educated person with no knowledge of statistics, why the paradox happens in this context.
a. Show that Simpson's paradox holds for these data. (Point out the relevant percentages and the relevant inequalities, i.e., which percentages are greater than which others.)
b. Write a sentence or two explaining, as if to an educated person with no knowledge of statistics, why the paradox happens in this context.
(Short Answer)
4.8/5 (45)
The following data are monthly rents (in dollars) of studio and one-bedroom apartments in Harrisburg and Philadelphia, Pennsylvania.
Harrisburg
Philadelphia
-Construct boxplots of the distributions of rent amounts in these two cities, using the same axis and scale. (Do not bother to check for outliers; there are no outliers in either distribution.)
(Short Answer)
4.8/5 (32)
An instructor conducted an in-class experiment where students memorized as many letters as possible from a strip of paper. Everyone received the same letters in the same order, but some students saw the letters in convenient three-letter groupings (such as JFK-CIA) whereas others saw less convenient groupings (such as JFKCIAF). Boxplots of the number of letters memorized correctly appear below:
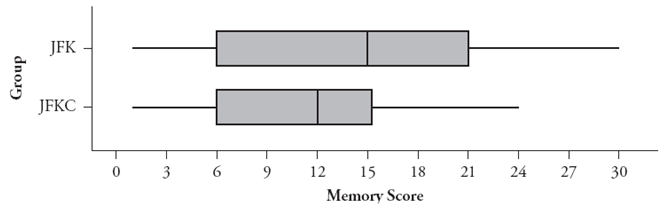 a. Report (as accurately as possible from the graph) the median score for each group:
JFK:
JFKC:
b. Report (as accurately as possible from the graph) the interquartile range for each group:
JFK:
JFKC:
c. Do the boxplots provide any evidence that students who received the letters in convenient three-letter groupings were able to memorize more letters than the other group? Explain briefly.
a. Report (as accurately as possible from the graph) the median score for each group:
JFK:
JFKC:
b. Report (as accurately as possible from the graph) the interquartile range for each group:
JFK:
JFKC:
c. Do the boxplots provide any evidence that students who received the letters in convenient three-letter groupings were able to memorize more letters than the other group? Explain briefly.
(Short Answer)
4.8/5 (38)
The following histogram displays the magnitudes of the 614 earthquakes with Richter scale magnitude greater than 1.0 that occurred in the United States between March 25 and April 1, 2004:
-Is the percentage of earthquakes of magnitude 3.0 or higher closest to , or ?
The following histograms display student responses to several questions on a course survey taken during the first day of a statistics class.
(Short Answer)
4.7/5 (36)
Filters
- Essay(0)
- Multiple Choice(0)
- Short Answer(0)
- True False(0)
- Matching(0)