Exam 2: Summarizing Data
Exam 1: Collecting Data and Drawing Conclusions60 Questions
Exam 2: Summarizing Data55 Questions
Exam 3: Randomness in Data61 Questions
Exam 4: Inference From Data: Principles57 Questions
Exam 5: Inference From Data: Comparisons22 Questions
Exam 6: Inferences With Categorical Data32 Questions
Exam 7: Relationships in Data35 Questions
Exam 8: Analyzing Probabilities and Expected Values34 Questions
Select questions type
In a study reported in the July 2007 issue of the Journal of Epidemiology and Community Health, researchers investigated whether veterans are more likely to commit suicide than nonveterans. They spent 12 years following 104,000 veterans who had served in the armed forces between 1917 and 1994, and compared them with 216,000 nonveterans. They found that 197 veterans and 311 nonveterans committed suicide.
-Calculate the relative risk of committing suicide, comparing veterans to nonveterans.
(Short Answer)
4.9/5  (35)
(35)
The following side-by-side stemplot displays the total number of points scored per Super Bowl football game for the first 41 Super Bowls (from 1967-2007), separated according to the first 20 games (19671986) and the next 21 games (1987-2007): 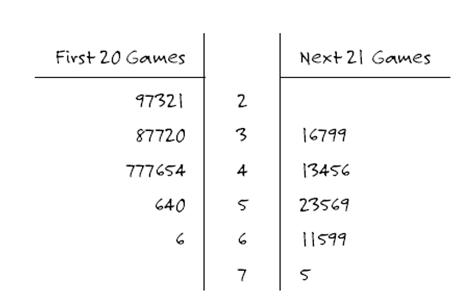 -The five lowest-scoring Super Bowls were all played among the first 20 games.
(True/False)
4.8/5 (41)
Suppose Ben records the noon temperature in New York City on every day in the month of June, and Frank records the noon temperature in New York City on every day in an entire year. Which one (Ben or Frank) would you expect to have the greater standard deviation of temperatures, or would you expect the standard deviations to be very similar? Explain briefly.
(Short Answer)
4.8/5 (46)
The following side-by-side stemplot displays the total number of points scored per Super Bowl football game for the first 41 Super Bowls (from 1967-2007), separated according to the first 20 games (19671986) and the next 21 games (1987-2007): 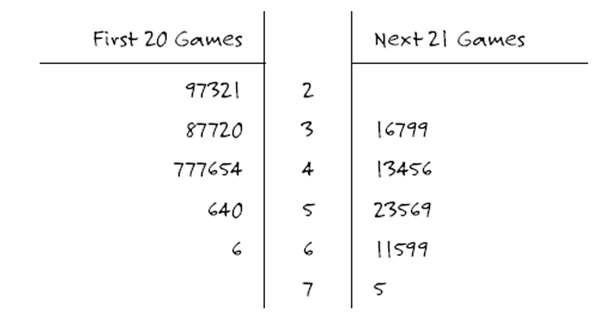 -Compare and contrast the distributions of total points between these two groups. Refer to appropriate calculations and displays to support your comments.
(Short Answer)
4.8/5 (27)
Is it possible for the mean value of a variable to be greater than all of the data values? Explain.
(Short Answer)
5.0/5 (46)
The following side-by-side stemplot displays the total number of points scored per Super Bowl football game for the first 41 Super Bowls (from 1967-2007), separated according to the first 20 games (19671986) and the next 21 games (1987-2007):
-The five highest-scoring Super Bowls were all played among the next 21 games.
(True/False)
4.7/5 (32)
The following histogram displays the magnitudes of the 614 earthquakes with Richter scale magnitude greater than 1.0 that occurred in the United States between March 25 and April 1, 2004: 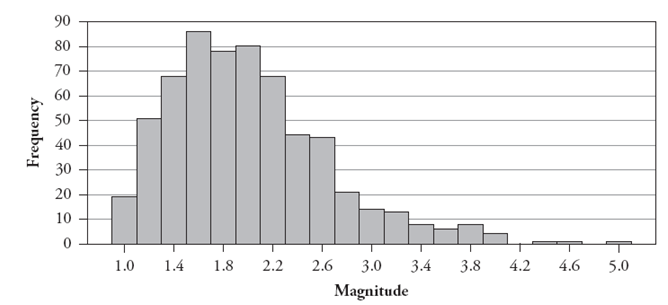 -Describe the shape of this distribution.
(Essay)
4.7/5 (38)
The following histograms display the distributions of percentage of a state's residents who are Mexican, for each region of the country (West, South, Northeast, Midwest). 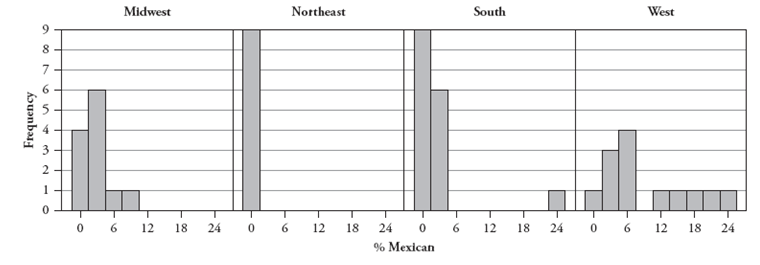 -For the south region, would you recommend reporting the standard deviation or the interquartile range as your measure of the spread of the distribution? Explain.
(Short Answer)
4.9/5 (36)
In a study reported in the July 2007 issue of the Journal of Epidemiology and Community Health, researchers investigated whether veterans are more likely to commit suicide than nonveterans. They spent 12 years following 104,000 veterans who had served in the armed forces between 1917 and 1994, and compared them with 216,000 nonveterans. They found that 197 veterans and 311 nonveterans committed suicide.
-Notice that more nonveterans than veterans committed suicide (311 vs. 197). Would you conclude that veterans are less likely to commit suicide than nonveterans? Explain.
(Short Answer)
4.8/5 (31)
A trimmed mean is another measure of center. For example, one trimmed mean deletes the highest of the values and the lowest of the values, and then takes the mean of the remaining of the values. Is this trimmed mean more or less resistant to outliers than the mean? Explain briefly.
(Essay)
4.9/5 (38)
The following histograms display the distributions of percentage of a state's residents who are Mexican, for each region of the country (West, South, Northeast, Midwest).
-Which region do you suspect has the smallest standard deviation in these percentages? Explain.
(Essay)
4.9/5 (32)
The following table reports counts of the number of "close friends" reported by a sample of men and a sample of women: 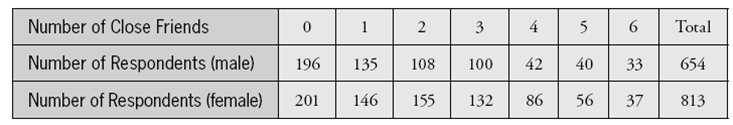 -Are these distributions roughly symmetric, skewed to the left, or skewed to the right? Explain briefly. (You do not need to construct any graphs.)
(Short Answer)
4.9/5 (45)
The following side-by-side stemplot displays the total number of points scored per Super Bowl football game for the first 41 Super Bowls (from 1967-2007), separated according to the first 20 games (19671986) and the next 21 games (1987-2007):
-Does this stemplot provide evidence that Super Bowl games have become more high-scoring over time, more low-scoring over time, or neither? Explain.
(Short Answer)
4.9/5 (42)
The following data are the speaking rates (in words per minute) of presidential candidates during televised debates in late September and early October of 2007:
Republicans:
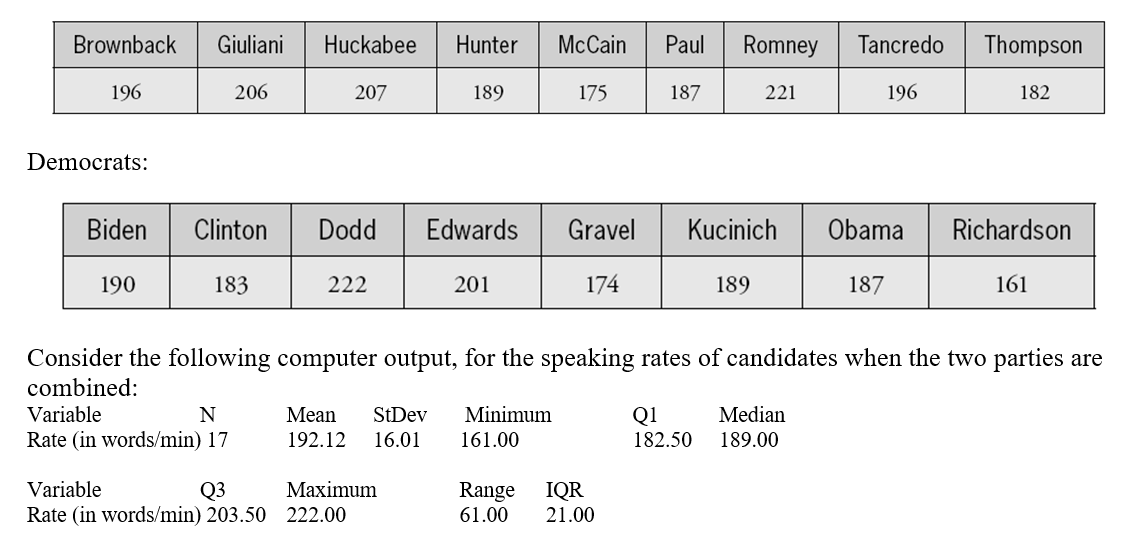 a. Use this output to determine whether there are any outliers in the data (again with the two parties combined).
The following boxplots display the speaking rates:
a. Use this output to determine whether there are any outliers in the data (again with the two parties combined).
The following boxplots display the speaking rates: 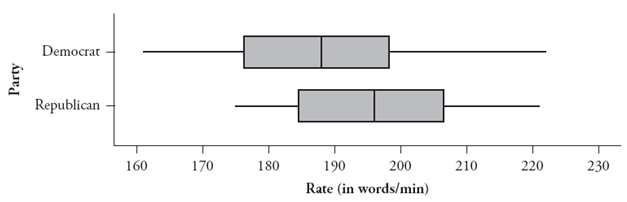 b. Report the median speaking rate for each party as accurately as you can from the graph.
c. Report the interquartile range of the speaking rates for each party as accurately as you can from the graph.
d. Summarize what these boxplots reveal about the speaking rates of the two parties' presidential candidates.
b. Report the median speaking rate for each party as accurately as you can from the graph.
c. Report the interquartile range of the speaking rates for each party as accurately as you can from the graph.
d. Summarize what these boxplots reveal about the speaking rates of the two parties' presidential candidates.
(Short Answer)
4.8/5 (35)
In a study reported in the July 2007 issue of the Journal of Epidemiology and Community Health, researchers investigated whether veterans are more likely to commit suicide than nonveterans. They spent 12 years following 104,000 veterans who had served in the armed forces between 1917 and 1994, and compared them with 216,000 nonveterans. They found that 197 veterans and 311 nonveterans committed suicide.
-Is this an experiment or an observational study? Explain briefly.
(Short Answer)
4.7/5 (36)
Filters
- Essay(0)
- Multiple Choice(0)
- Short Answer(0)
- True False(0)
- Matching(0)