Exam 9: Inference for Regression
Exam 1: Collecting Data68 Questions
Exam 2: Describing Data125 Questions
Exam 3: Confidence Intervals148 Questions
Exam 4: Hypothesis Tests119 Questions
Exam 5: Approximating With a Distribution74 Questions
Exam 6: Inference for Means and Proportions166 Questions
Exam 7: Chi-Square Tests for Categorical Variables47 Questions
Exam 8: Anova to Compare Means52 Questions
Exam 9: Inference for Regression123 Questions
Exam 10: Multiple Regression72 Questions
Exam 11: Probability Basics165 Questions
Select questions type
Use the following
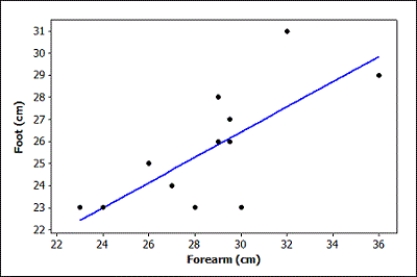
Students in a small statistics course wanted to investigate if forearm length (in cm) was useful for predicting foot length (in cm). The data they collected are displayed in the provided scatterplot (with regression), and the computer output from the analysis is provided.
Use three decimal places when reporting the results from any calculations, unless otherwise specified.
The regression equation is Foot (cm) = 9.22 + 0.574 Forearm (cm)

 Predicted Values for New Observations

 -Use the ANOVA table to find the standard deviation of the error term.
(Essay)
4.9/5  (32)
(32)
Use the following
In a regression analysis with n = 25, SSE = 1,800 and SSTotal = 2,000.
-Compute the standard deviation of the error term. Use two decimal places in your answer.
(Essay)
4.8/5 (33)
Use the following
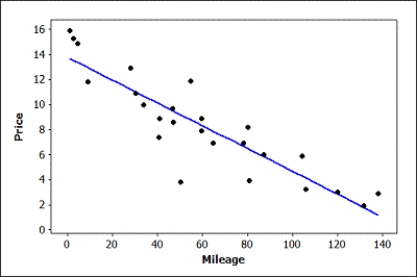
Data were collected on the mileage (in thousands of miles) and price (in thousands of dollars) of a random sample of used Hyundai Elantras. A scatterplot of the data (with regression line), some summary statistics, and partial computer output from a regression analysis are provided.
Use three decimal places when reporting the results from any calculations, unless otherwise specified.
 The regression equation is Price = 13.8 - 0.0912 Mileage

 -Use the following computer output to identify and interpret a 95% interval for the price of a single used Hyundai Elantra with 70,000 miles.

(Essay)
4.9/5 (28)
Filters
- Essay(0)
- Multiple Choice(0)
- Short Answer(0)
- True False(0)
- Matching(0)