Exam 18: Public Choice, Taxes, and the Distribution of Income
Exam 1: Economics: Foundations and Models234 Questions
Exam 2: Trade-Offs, Comparative Advantage, and the Market System258 Questions
Exam 3: Where Prices Come From: the Interaction of Demand and Supply242 Questions
Exam 4: Economic Efficiency, Government Price Setting, and Taxes208 Questions
Exam 5: Externalities, Environmental Policy, and Public Goods263 Questions
Exam 6: Elasticity: the Responsiveness of Demand and Supply295 Questions
Exam 7: The Economics of Health Care171 Questions
Exam 8: Firms, the Stock Market, and Corporate Governance264 Questions
Exam 9: Comparative Advantage and the Gains From International Trade188 Questions
Exam 10: Consumer Choice and Behavioral Economics300 Questions
Exam 11: Technology, Production, and Costs328 Questions
Exam 12: Firms in Perfectly Competitive Markets296 Questions
Exam 13: Monopolistic Competition: the Competitive Model in a More Realistic Setting274 Questions
Exam 14: Oligopoly: Firms in Less Competitive Markets259 Questions
Exam 15: Monopoly and Antitrust Policy279 Questions
Exam 16: Pricing Strategy261 Questions
Exam 17: The Markets for Labor and Other Factors of Production281 Questions
Exam 18: Public Choice, Taxes, and the Distribution of Income258 Questions
Select questions type
Figure 18-7
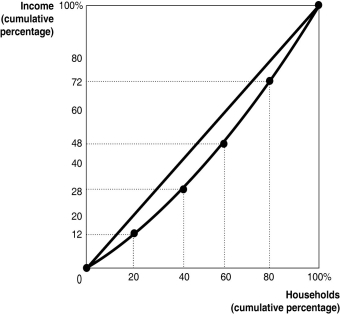 Figure 18-7 shows the Lorenz curve for a hypothetical country.
-Refer to Figure 18-7.The second highest 20 percent of households
Figure 18-7 shows the Lorenz curve for a hypothetical country.
-Refer to Figure 18-7.The second highest 20 percent of households
(Multiple Choice)
4.8/5  (32)
(32)
Holding all other factors constant, income earned from capital is more unequally distributed than income earned from labor.
(True/False)
4.8/5 (36)
The largest percentage of federal income tax revenue in the United States is paid by the
(Multiple Choice)
4.9/5 (44)
Economist Kenneth Arrow has shown mathematically that no system of voting will consistently represent the underlying preferences of voters.This finding is called
(Multiple Choice)
4.8/5 (44)
What is the difference between the voting paradox and the Arrow impossibility theorem?
(Essay)
4.9/5 (38)
Figure 18-2
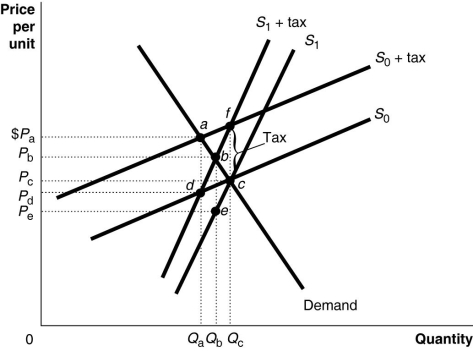 Figure 18-2 shows a demand curve and two sets of supply curves, one set more elastic than the other.
-Refer to Figure 18-2.If the government imposes an excise tax of $1.00 on every unit sold, the government's revenue from the tax
Figure 18-2 shows a demand curve and two sets of supply curves, one set more elastic than the other.
-Refer to Figure 18-2.If the government imposes an excise tax of $1.00 on every unit sold, the government's revenue from the tax
(Multiple Choice)
4.8/5 (36)
Between 1980 and 2014, income inequality in the United States has increased in part due to expanding international trade.How does expanding international trade contribute to income inequality?
(Multiple Choice)
4.9/5 (45)
If official poverty statistics for the United States included transfer payments individuals receive from the government, such as Social Security payments and other non-cash benefits such as food stamps,
(Multiple Choice)
4.8/5 (42)
The government of Silverado raises revenue through a general income tax paid by all its residents to operate the city's marina.The marina is used by private boat owners.This method of raising revenue to operate the marina is
(Multiple Choice)
4.8/5 (36)
If your income is $40,000 and you pay taxes of $4,650, what is your average tax rate? Show your work.
(Essay)
4.9/5 (36)
Figure 18-2
Figure 18-2 shows a demand curve and two sets of supply curves, one set more elastic than the other.
-Refer to Figure 18-2.If the government imposes an excise tax of $1.00 on every unit sold,
(Multiple Choice)
4.8/5 (39)
Filters
- Essay(0)
- Multiple Choice(0)
- Short Answer(0)
- True False(0)
- Matching(0)