Exam 18: Public Choice, Taxes, and the Distribution of Income
Exam 1: Economics: Foundations and Models234 Questions
Exam 2: Trade-Offs, Comparative Advantage, and the Market System258 Questions
Exam 3: Where Prices Come From: the Interaction of Demand and Supply242 Questions
Exam 4: Economic Efficiency, Government Price Setting, and Taxes208 Questions
Exam 5: Externalities, Environmental Policy, and Public Goods263 Questions
Exam 6: Elasticity: the Responsiveness of Demand and Supply295 Questions
Exam 7: The Economics of Health Care171 Questions
Exam 8: Firms, the Stock Market, and Corporate Governance264 Questions
Exam 9: Comparative Advantage and the Gains From International Trade188 Questions
Exam 10: Consumer Choice and Behavioral Economics300 Questions
Exam 11: Technology, Production, and Costs328 Questions
Exam 12: Firms in Perfectly Competitive Markets296 Questions
Exam 13: Monopolistic Competition: the Competitive Model in a More Realistic Setting274 Questions
Exam 14: Oligopoly: Firms in Less Competitive Markets259 Questions
Exam 15: Monopoly and Antitrust Policy279 Questions
Exam 16: Pricing Strategy261 Questions
Exam 17: The Markets for Labor and Other Factors of Production281 Questions
Exam 18: Public Choice, Taxes, and the Distribution of Income258 Questions
Select questions type
All Gini coefficients must lie between 0 and 1.The lower the value
(Multiple Choice)
4.9/5  (47)
(47)
If, as your taxable income decreases, you pay a larger percentage of your taxable income in taxes, then the tax is
(Multiple Choice)
4.9/5 (32)
Suppose the equilibrium price and quantity of a 12-pack of Dr.Pepper are $5.00 and 10,000 12-packs, respectively, and the government decides to impose a $1.00 tax on every 12-pack of carbonated soft drinks.Draw two supply and demand graphs, one showing the excess burden of the tax when supply is less elastic and the other showing the excess burden of the tax when supply is more elastic.Identify the excess burden of the tax on each graph.On which graph is the excess burden the greatest?
(Essay)
4.8/5 (42)
Figure 18-4
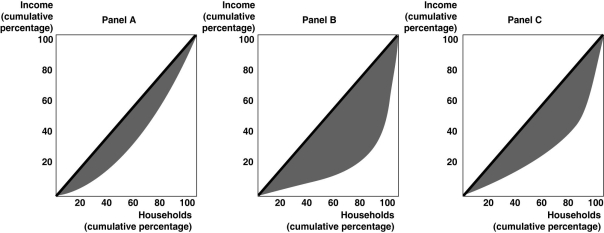 -Refer to Figure 18-4.Rank the above panels in terms of most unequal income distribution to least unequal income distribution.
(Multiple Choice)
4.8/5 (41)
If you pay $2,000 in taxes on an income of $20,000, and a tax of $3,500 on an income of $30,000, then over this range of income the tax is
(Multiple Choice)
4.8/5 (34)
Table 18-12
 Table 18-12 shows income distribution data for two countries.Use this data to answer the following questions.
-Refer to Table 18-12.
a.Draw a Lorenz curve for each country.
b.Which country has the more equal distribution of income?
c.Based on the Lorenz curves for the two countries, can you determine which country has the more progressive tax system? Explain your answer.
Table 18-12 shows income distribution data for two countries.Use this data to answer the following questions.
-Refer to Table 18-12.
a.Draw a Lorenz curve for each country.
b.Which country has the more equal distribution of income?
c.Based on the Lorenz curves for the two countries, can you determine which country has the more progressive tax system? Explain your answer.
(Essay)
4.8/5 (36)
The median voter theorem states that the outcome of a majority vote
(Multiple Choice)
4.8/5 (41)
In the United States, the largest source of funds for public schools is
(Multiple Choice)
4.7/5 (35)
If, as your taxable income decreases, you pay a smaller percentage of your taxable income in taxes, then the tax is
(Multiple Choice)
4.9/5 (33)
A regressive tax is a tax for which people with lower incomes
(Multiple Choice)
4.8/5 (34)
Figure 18-5
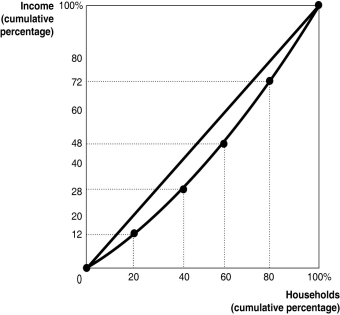 Figure 18-5 shows the Lorenz curve for a hypothetical country.
-Refer to Figure 18-5.The middle 20 percent of households
Figure 18-5 shows the Lorenz curve for a hypothetical country.
-Refer to Figure 18-5.The middle 20 percent of households
(Multiple Choice)
4.8/5 (41)
Table 18-9
 Table 18-9 shows the income tax brackets and tax rates for single taxpayers in Monrovia.
-Refer to Table 18-9.Calculate the income tax paid by Sylvia, a single taxpayer with an income of $70,000.
Table 18-9 shows the income tax brackets and tax rates for single taxpayers in Monrovia.
-Refer to Table 18-9.Calculate the income tax paid by Sylvia, a single taxpayer with an income of $70,000.
(Multiple Choice)
4.8/5 (44)
The idea that two taxpayers in the same economic circumstances should pay the same level of taxes is known as the
(Multiple Choice)
4.8/5 (45)
Measures of poverty (for example, the poverty line)and the distribution of income (for example, the Lorenz curve and the Gini coefficient)are misleading for which of the following two reasons?
(Multiple Choice)
5.0/5 (32)
Figure 18-3
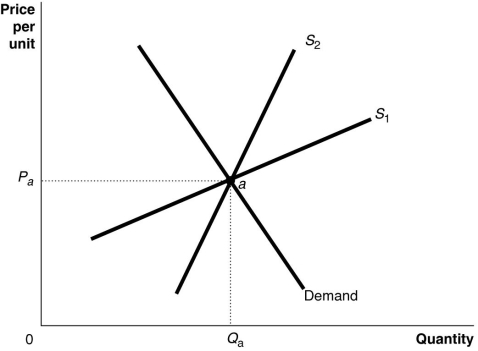 -Refer to Figure 18-3.The figure above shows a demand curve and two supply curves, one more elastic than the other.Use Figure 18-3 to answer the following questions.
a.Suppose the government imposes an excise tax of $1.00 on every unit sold.Use the graph to illustrate the impact of this tax.
b.If the government imposes an excise tax of $1.00 on every unit sold, will the consumer pay more of the tax if the supply curve is S₁ or S₂? Refer to the graphs in your answer.
c.If an excise tax of $1.00 on every unit sold is imposed, will the revenue collected by the government be greater if the supply curve is S₁ or S₂?
d.If the government imposes an excise tax of $1.00 on every unit sold, will the deadweight loss be greater if the supply curve is S₁ or S₂?
-Refer to Figure 18-3.The figure above shows a demand curve and two supply curves, one more elastic than the other.Use Figure 18-3 to answer the following questions.
a.Suppose the government imposes an excise tax of $1.00 on every unit sold.Use the graph to illustrate the impact of this tax.
b.If the government imposes an excise tax of $1.00 on every unit sold, will the consumer pay more of the tax if the supply curve is S₁ or S₂? Refer to the graphs in your answer.
c.If an excise tax of $1.00 on every unit sold is imposed, will the revenue collected by the government be greater if the supply curve is S₁ or S₂?
d.If the government imposes an excise tax of $1.00 on every unit sold, will the deadweight loss be greater if the supply curve is S₁ or S₂?
(Essay)
4.7/5 (32)
Rapid economic growth tends to increase the degree of income mobility.
(True/False)
4.9/5 (40)
Filters
- Essay(0)
- Multiple Choice(0)
- Short Answer(0)
- True False(0)
- Matching(0)