Exam 1: Getting Started
Exam 1: Getting Started272 Questions
Exam 2: The Australian and Global Economies171 Questions
Exam 3: The Economic Problem218 Questions
Exam 4: Demand and Supply144 Questions
Exam 5: Gdp: a Measure of Total Production and Income135 Questions
Exam 6: Jobs and Unemployment133 Questions
Exam 7: The Cpi and the Cost of Living131 Questions
Exam 8: Economic Growth138 Questions
Exam 9: Finance,saving and Investment157 Questions
Exam 10: Money,the Price Level and Inflation213 Questions
Exam 11: Aggregate Supply and Aggregate Demand176 Questions
Exam 12: Aggregate Expenditure Multiplier189 Questions
Exam 13: The Short-Run Policy Trade Off134 Questions
Exam 14: Fiscal Policy148 Questions
Exam 15: Monetary Policy108 Questions
Exam 16: International Trade Policy122 Questions
Exam 17: International Finance145 Questions
Select questions type
You have data for sales of pizza for each Australian state in 2011.The type of graph to best display these data would be a
(Multiple Choice)
4.9/5  (37)
(37)
Most economic graphs have two lines perpendicular to each other.The vertical line is called the
(Multiple Choice)
4.9/5 (38)
If a decision is made and it is the best choice for society,the decision is said to be
(Multiple Choice)
4.8/5 (34)
Two variables are unrelated if their graph is i.a vertical line.
Ii)a 45 degree line.
Iii)a horizontal line.
(Multiple Choice)
4.8/5 (31)
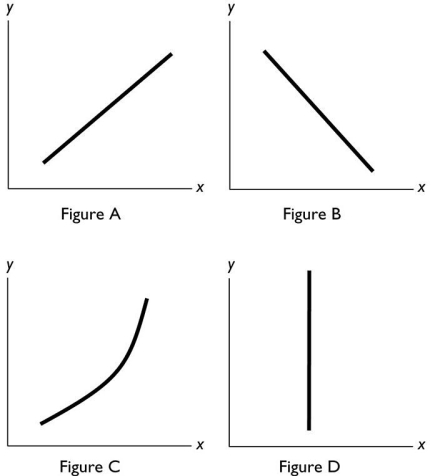 -In the diagram above,which figure(s)show(s)a direct relationship between the variables?
(Multiple Choice)
4.7/5 (38)
A time-series graph reveals whether there ________,which represents ________.
(Multiple Choice)
4.9/5 (36)
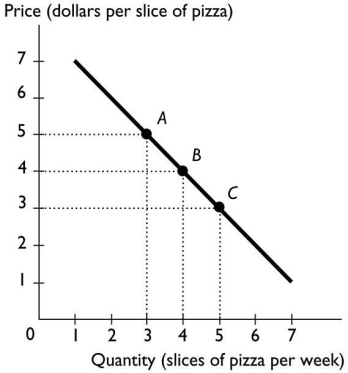 -The above figure shows the relationship between the price of a slice of pizza and how many slices of pizza Ricardo buys in a week.Between points A and B,the slope of the line is ________ the slope of the line between points B and C.
(Multiple Choice)
4.8/5 (37)
Mothers Against Drunk Drivers (MADD)campaigned to increase the legal penalties of drunk driving.This successful campaign ________ of drunk driving.
(Multiple Choice)
4.8/5 (45)
Which of the following is an example of a positive economic statement?
(Multiple Choice)
4.7/5 (43)
Suppose you take a trip during the mid-semester break.To determine the benefit of taking the trip,you
(Multiple Choice)
4.7/5 (35)
Normative statements i.describe how the world is.
Ii)describe how the world ought to be.
Iii)depend on people's values and cannot be tested.
(Multiple Choice)
5.0/5 (41)
As part of its proposal to win the 2012 Olympics,London developed a carbon offset plan to reduce the Games' impact on the environment.In 2011,the organisers decided to drop the plan to reduce emissions.We can conclude that
(Multiple Choice)
5.0/5 (30)
Which of the following is a macroeconomic topic?
i.China increases interest rates to slow its economic growth.
ii.Parliament lowers tax rates to try to lower the unemployment rate.
iii.Nissan decides to produce more electric Leaf models and fewer Altima sedans.
(Multiple Choice)
4.9/5 (41)
Filters
- Essay(0)
- Multiple Choice(0)
- Short Answer(0)
- True False(0)
- Matching(0)