Exam 1: Getting Started
Exam 1: Getting Started272 Questions
Exam 2: The Australian and Global Economies171 Questions
Exam 3: The Economic Problem218 Questions
Exam 4: Demand and Supply144 Questions
Exam 5: Gdp: a Measure of Total Production and Income135 Questions
Exam 6: Jobs and Unemployment133 Questions
Exam 7: The Cpi and the Cost of Living131 Questions
Exam 8: Economic Growth138 Questions
Exam 9: Finance,saving and Investment157 Questions
Exam 10: Money,the Price Level and Inflation213 Questions
Exam 11: Aggregate Supply and Aggregate Demand176 Questions
Exam 12: Aggregate Expenditure Multiplier189 Questions
Exam 13: The Short-Run Policy Trade Off134 Questions
Exam 14: Fiscal Policy148 Questions
Exam 15: Monetary Policy108 Questions
Exam 16: International Trade Policy122 Questions
Exam 17: International Finance145 Questions
Select questions type
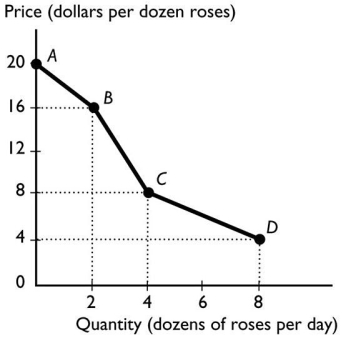 -The figure above shows the relationship between the price of a dozen roses and the quantity of roses a florist can sell.The slope between points B and C equals
(Multiple Choice)
4.8/5  (41)
(41)
'The change in the value of the variable measured on the y-axis divided by the change in the value of the variable measured on the x-axis' is the definition of
(Multiple Choice)
4.9/5 (46)
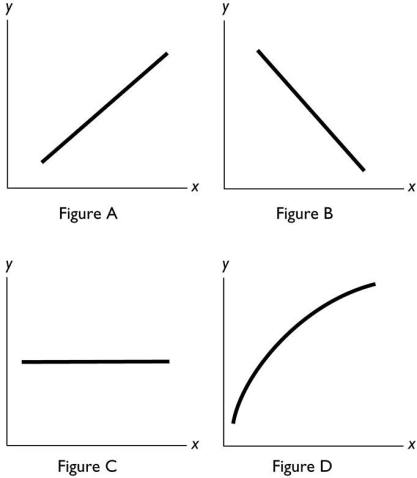 -In the above figure,a negative relationship between x and y is shown in Figure
(Multiple Choice)
4.9/5 (39)
Your lecturer changes the penalty for cheating on exams from getting a 0 on the exam to getting an F in the course.Your lecturer has
(Multiple Choice)
4.9/5 (30)
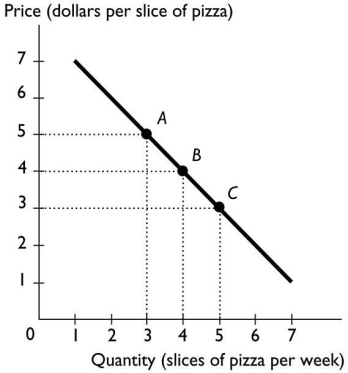 -The above figure shows the relationship between the price of a slice of pizza and how many slices of pizza Ricardo buys in a week.Between points A and B,the slope of the line equals
(Multiple Choice)
4.8/5 (44)
Which of the following is the best example of a 'what? ' question?
(Multiple Choice)
4.9/5 (41)
If x increases and as a result y decreases,then x and y are
(Multiple Choice)
4.7/5 (38)
When two variables in a graph are related to a third,changing the third causes
(Multiple Choice)
4.8/5 (37)
-The figure above shows the relationship between the price of a dozen roses and the quantity of roses a florist can sell.The slope between points C and D equals
(Multiple Choice)
4.7/5 (37)
Because human wants are insatiable and unlimited while available resources are limited,people are said to face the problem of
(Multiple Choice)
4.8/5 (37)
An economist observed that,as more computers are added to a factory,the costs of production initially decline,reach a minimum,and then rise.In a diagram that has costs on the vertical axis and the number of computers on the horizontal axis,the relationship always is
(Multiple Choice)
4.9/5 (31)
Filters
- Essay(0)
- Multiple Choice(0)
- Short Answer(0)
- True False(0)
- Matching(0)