Exam 1: Getting Started
Exam 1: Getting Started272 Questions
Exam 2: The Australian and Global Economies171 Questions
Exam 3: The Economic Problem218 Questions
Exam 4: Demand and Supply144 Questions
Exam 5: Gdp: a Measure of Total Production and Income135 Questions
Exam 6: Jobs and Unemployment133 Questions
Exam 7: The Cpi and the Cost of Living131 Questions
Exam 8: Economic Growth138 Questions
Exam 9: Finance,saving and Investment157 Questions
Exam 10: Money,the Price Level and Inflation213 Questions
Exam 11: Aggregate Supply and Aggregate Demand176 Questions
Exam 12: Aggregate Expenditure Multiplier189 Questions
Exam 13: The Short-Run Policy Trade Off134 Questions
Exam 14: Fiscal Policy148 Questions
Exam 15: Monetary Policy108 Questions
Exam 16: International Trade Policy122 Questions
Exam 17: International Finance145 Questions
Select questions type
When unskilled teens earn less than university graduates,society answers the ________ question.
(Multiple Choice)
4.7/5  (43)
(43)
An independent relationship between two variables is shown in a graph by
(Multiple Choice)
4.9/5 (39)
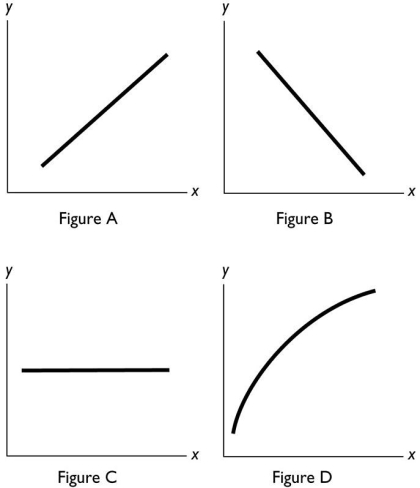 -In the above figure,which of the figures show a relationship between x and y with a negative slope?
(Multiple Choice)
4.9/5 (39)
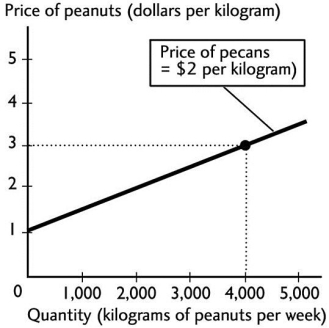 -In the figure above,suppose the price of a kilogram of pecans is negatively related to the quantity of peanuts that farmers are willing to supply.If the price of pecans increases,
(Multiple Choice)
4.9/5 (33)
As a person increases his or her caloric intake,the person's weight increases,ceteris paribus.The relationship between the person's caloric intake and the person's weight is an example of
(Multiple Choice)
4.8/5 (40)
When an electricity distribution company decides to use manpower to bury its lines,it directly answers the ________ question.
(Multiple Choice)
4.7/5 (41)
Whenever one variable increases,another variable decreases.The two variables are
(Multiple Choice)
4.8/5 (43)
If the marginal benefit of getting a university degree rises,rational people will
(Multiple Choice)
4.8/5 (37)
A choice made by comparing all relevant alternatives systematically and incrementally is
(Multiple Choice)
4.9/5 (38)
When the Adelaide Crows score more than 100 points in a home game,they win the game.This is an example of
(Multiple Choice)
4.7/5 (43)
A graph that shows how the amount of advertising expenditure differs among various industries can be shown
(Multiple Choice)
4.8/5 (40)
The benefit from a good or service that you purchase is measured by
(Multiple Choice)
4.8/5 (44)
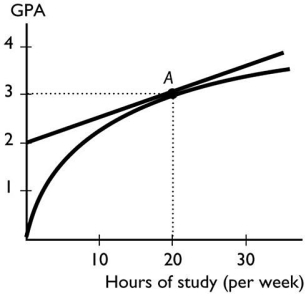 The figure above shows the relationship between the time a student spends studying and the student's GPA that semester.The slope of the relationship at point A equals
(Multiple Choice)
4.9/5 (33)
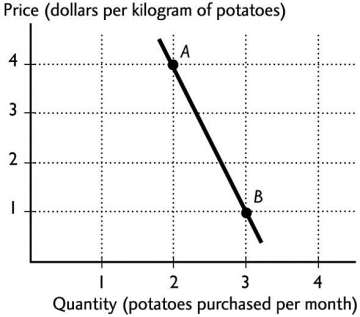 In the figure above,between points A and B,what is the slope of the line?
(Multiple Choice)
4.9/5 (36)
Amy can study for an hour or spend that hour sleeping or going out for dinner.If she decides to study for the hour,the opportunity cost of the hour spent studying is
(Multiple Choice)
4.7/5 (38)
 -In the above figure,no relationship between x and y is shown in Figure
(Multiple Choice)
4.9/5 (33)
With y measured on the vertical axis and x measured on the horizontal axis,the slope of a straight line is defined as
(Multiple Choice)
4.8/5 (32)
Filters
- Essay(0)
- Multiple Choice(0)
- Short Answer(0)
- True False(0)
- Matching(0)