Exam 1: Getting Started
Exam 1: Getting Started272 Questions
Exam 2: The Australian and Global Economies171 Questions
Exam 3: The Economic Problem218 Questions
Exam 4: Demand and Supply144 Questions
Exam 5: Gdp: a Measure of Total Production and Income135 Questions
Exam 6: Jobs and Unemployment133 Questions
Exam 7: The Cpi and the Cost of Living131 Questions
Exam 8: Economic Growth138 Questions
Exam 9: Finance,saving and Investment157 Questions
Exam 10: Money,the Price Level and Inflation213 Questions
Exam 11: Aggregate Supply and Aggregate Demand176 Questions
Exam 12: Aggregate Expenditure Multiplier189 Questions
Exam 13: The Short-Run Policy Trade Off134 Questions
Exam 14: Fiscal Policy148 Questions
Exam 15: Monetary Policy108 Questions
Exam 16: International Trade Policy122 Questions
Exam 17: International Finance145 Questions
Select questions type
A graph showing the values of an economic variable for different groups in a population at a point in time is called a
(Multiple Choice)
4.7/5  (45)
(45)
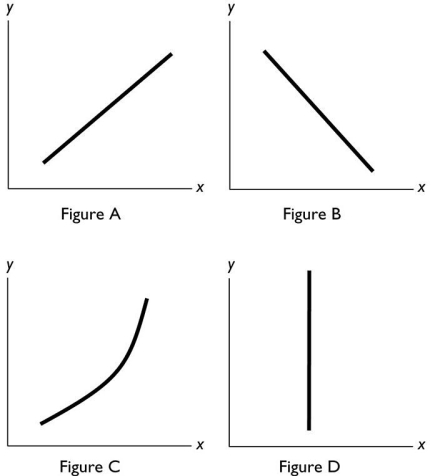 -In the diagram above,which figure(s)show(s)no relationship between the variables?
(Multiple Choice)
4.8/5 (33)
A graph shows the wage rate of factory workers.The slope of the line is positive for periods when the wage rate is
(Multiple Choice)
4.8/5 (36)
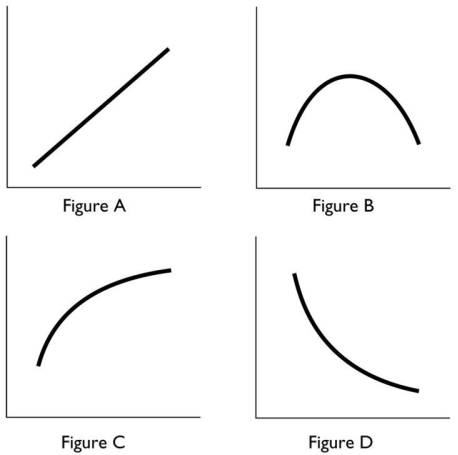 -In the above,which figures show a relationship between the variables that is always negative?
(Multiple Choice)
4.9/5 (40)
When Ferrari decides to produce 1,200 '360 Modenas' each year,Ferrari is answering the ________ question.
(Multiple Choice)
4.9/5 (33)
Proponents of cuts to income tax rates argue that when income tax rates are cut,workers have an incentive to increase their work hours.This argument is based on the assumption that
(Multiple Choice)
4.9/5 (26)
Demonstrating how an economic variable changes from one year to the next is best illustrated by a
(Multiple Choice)
4.8/5 (34)
Australia has a universal health care system called Medicare,so that everyone,regardless of their ability to pay,has some access to health care.Based on this observation,Australia has decided that 'everyone,regardless of their ability to pay' is the answer to what microeconomic question?
(Multiple Choice)
4.8/5 (37)
A graph shows the average ATAR scores for males and females in 2012.The kind of graph used to show these data would be a
(Multiple Choice)
4.9/5 (37)
In examining two variables,we find that as one variable changes,the other changes.These variables are said to be
(Multiple Choice)
4.9/5 (37)
Ali decides to attend the one-hour review session for microeconomics instead of working at his job.His job pays him $10 per hour.Ali's opportunity cost of attending the review session is
(Multiple Choice)
4.9/5 (36)
The value of the best thing that a person must give up when making a decision is known as the ________ cost.
(Multiple Choice)
4.7/5 (39)
 -To graph a relationship that involves more than two variables,we use
(Multiple Choice)
4.8/5 (38)
Filters
- Essay(0)
- Multiple Choice(0)
- Short Answer(0)
- True False(0)
- Matching(0)