Exam 5: Working With Excel Tables, Pivot-tables, and Pivot-charts
Exam 1: Getting Started With Excel150 Questions
Exam 2: Formatting a Workbook150 Questions
Exam 3: Working With Formulas and Functions150 Questions
Exam 4: Enhancing a Workbook With Charts and Graphs150 Questions
Exam 5: Working With Excel Tables, Pivot-tables, and Pivot-charts150 Questions
Exam 6: Managing Multiple Worksheets and Workbooks150 Questions
Exam 7: Using Advanced Functions and Conditional Formatting150 Questions
Exam 8: Developing an Excel Application150 Questions
Exam 9: Working With Financial Tools and Functions150 Questions
Exam 10: Performing What-If Analyses150 Questions
Exam 11: Connecting to External Data150 Questions
Exam 12: Expanding Excel With Visual Basic for Applications150 Questions
Exam 13: Managing Your Files150 Questions
Exam 14: Getting Started With Microsoft Office 2010150 Questions
Select questions type
Typically,you want to sort by the numbers,text,or dates stored in the cells,which are all ____________________.
(Short Answer)
4.8/5  (29)
(29)
Excel can summarize data in a range of data by inserting subtotals.
(True/False)
4.8/5 (48)
What is a PivotTable? Describe its use in Excel,including the definition of value fields and category fields.
(Essay)
4.9/5 (38)
Before you complete a sort,you need to decide whether you want to put the list in ascending or descending order.
(True/False)
4.9/5 (41)
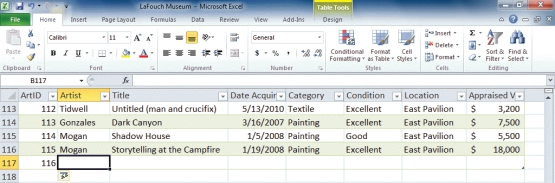 -The QuickFix button shown in the accompanying figure enables you to undo table formatting if,for example,you had not intended new data to be part of an existing table._________________________
(True/False)
4.9/5 (45)
To calculate subtotal for a table,the first step is to use the ____ button on the Table Tools Design tab.
(Multiple Choice)
4.7/5 (36)
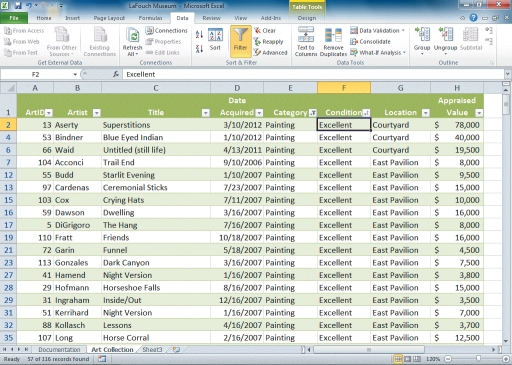 -Records have been filtered in the list shown in the accompanying figure.
(True/False)
4.7/5 (42)
In Excel,a table is a range of related data that is managed independently from the data in other ____ in the worksheet.
(Multiple Choice)
4.7/5 (32)
A(n)____________________ is an interactive table that enables you to group and summarize an Excel list into a concise,tabular format for easier reporting and analysis.
(Short Answer)
4.9/5 (38)
The ____ criteria filter requires the records displayed to be greater than or equal to and less than or equal to the specified numbers.
(Multiple Choice)
4.9/5 (37)
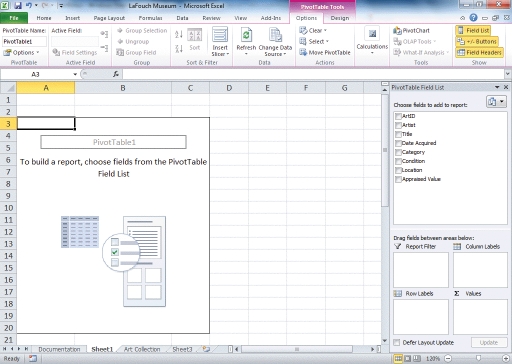 -The box that is covering columns A,B,and C in the figure above is the PivotTable ________________ area.
(Short Answer)
4.9/5 (36)
A(n)____________________ is a graphical representation of the data in a PivotTable.
(Short Answer)
4.8/5 (25)
You can use a table's sizing handle to add columns or rows to a table.
(True/False)
5.0/5 (47)
In laying out the PivotTable on the worksheet,you can drag the Condition field button from the Row Labels box to the Column Labels box.The PivotTable is rearranged so that the Condition field is a ____ label.
(Multiple Choice)
4.8/5 (34)
Jamie wants to use her PivotTable to show the total value of the cars for a series of car dealerships but she wants to filter the display to show only those dealers whose total stock of cars is greater than $1 million.How would she accomplish this?
(Multiple Choice)
4.9/5 (37)
A PivotTable summarizes data in different categories using functions such as ____.
(Multiple Choice)
4.9/5 (41)
A dark,horizontal line appears ____ the column headers to indicate which row is frozen.
(Multiple Choice)
4.8/5 (48)
The simplest and most convenient way to add a record to a table is to enter the data in the first blank row below the last record.
(True/False)
4.9/5 (38)
Filters
- Essay(0)
- Multiple Choice(0)
- Short Answer(0)
- True False(0)
- Matching(0)