Exam 3: Applying Advanced Formatting to Objects
Exam 1: Creating a Presentation100 Questions
Exam 2: Adding Media and Special Effects100 Questions
Exam 3: Applying Advanced Formatting to Objects100 Questions
Exam 4: Advanced Animations and Distributing Presentations100 Questions
Exam 5: Managing Your Files100 Questions
Exam 6: Planning, developing, and Giving a Presentation99 Questions
Select questions type
MATCHING
-Separates overlapping portions of shapes into separate shapes
Free
(Multiple Choice)
4.8/5  (33)
(33)
Correct Answer: Verified
B
If you convert a SmartArt object into drawn shapes,you will still have access to the commands on the SmartArt Tools contextual tabs.
Free
(True/False)
4.7/5 (37)
Correct Answer:Verified
False
Please describe the following types of charts and when they should be used: column,bar,line,area,and pie.
Free
(Essay)
4.8/5 (40)
Correct Answer:Verified
Column charts use vertical columns and bar charts use horizontal bars to represent values.
These types of charts are useful for comparing the values of items over a period of time or a range of dates or costs.
Line charts use a line to connect points that represent values.
They are effective for showing changes over time,and they are particularly useful for illustrating trends.
Area charts are similar to line charts,but show shading from the line down to the x-axis.
Line and area charts are a better choice than column or bar charts when you need to display large amounts of information and exact quantities that don't require emphasis.
Pie charts are used to show percentages or proportions of the parts that make up a whole.
To create a custom gradient within a shape,the GRADIENT OPTIONS tab must be selected in the Format Shape task pane.
_________________________
(True/False)
4.7/5 (31)
Case 3-1
In PowerPoint 2013, Jim has been inserting text using the text box placeholders included in the slide layout. He wants to be able to add text to other locations on the slide.
-Jim wants to insert text that appears in a box that is already filled with Accent color 1 and where the text is center-aligned.
Jim should insert a _____.
(Multiple Choice)
4.8/5 (39)
TextArt is a term used to describe formatted,decorative text in a text box.
_________________________
(True/False)
5.0/5 (38)
When only a picture is selected,the Format Picture task pane includes tabs with groups of buttons.
(True/False)
4.9/5 (33)
_____ charts use a line to connect points that represent values,and also show shading from the line down to the x-axis.
(Multiple Choice)
4.8/5 (34)
A(n) gradient is shading in which one color blends into another or varies from one shape to another.
_________________________
(True/False)
4.7/5 (31)
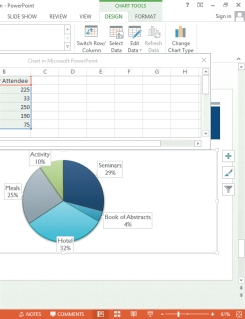 -Referring to the accompanying illustration,drag a sizing handle to _____ from the chart.
(Multiple Choice)
4.8/5 (37)
To use preset options in the _____ Shape task pane,you can use the Shape Fill and Shape Outline buttons.
(Multiple Choice)
4.8/5 (31)
If you need to modify a chart's data,click the Edit Data button in the Data group on the CHART TOOLS ____________________ tab.
(Short Answer)
4.9/5 (36)
WordArt text has a fill color,which is the same as the _____ color.
(Multiple Choice)
4.9/5 (43)
To add a sound clip to a slide,you use the Audio button in the Media group on the DESIGN tab.
_________________________
(True/False)
4.9/5 (41)
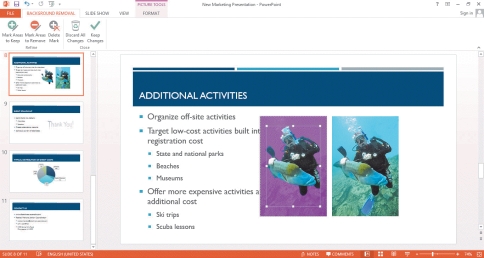 -Referring to the accompanying illustration,when you are done removing the background,on the BACKGROUND REMOVAL tab,in the _____ group,click the Keep Changes button.
(Multiple Choice)
4.8/5 (29)
Case 3-2
In PowerPoint 2013, Bella is learning how to merge shapes. She has merged one shape with the help of a co-worker, and is now ready to try it on her own.
-If Bella wants to merge two shapes but wants the overlapping parts of the shapes to be removed,she should use the _____ command.
(Multiple Choice)
4.9/5 (31)
Case 3-2
In PowerPoint 2013, Bella is learning how to merge shapes. She has merged one shape with the help of a co-worker, and is now ready to try it on her own.
-Bella is having trouble selecting two shapes,and then remembers that she needs to press _____ while she selects the second shape.
(Multiple Choice)
4.8/5 (33)
____________________ charts use vertical columns and bar charts use horizontal bars to represent values.
(Short Answer)
4.8/5 (27)
Filters
- Essay(0)
- Multiple Choice(0)
- Short Answer(0)
- True False(0)
- Matching(0)