Exam 10: Project Scheduling: Lagging, Crashing, and Activity Networks
Exam 1: Introduction: Why Project Management105 Questions
Exam 2: The Organizational Context: Strategy, Structure, and Culture105 Questions
Exam 3: Project Selection and Portfolio Management103 Questions
Exam 4: Leadership and the Project Manager112 Questions
Exam 5: Scope Management111 Questions
Exam 6: Project Team Building, Conflict, and Negotiation102 Questions
Exam 7: Risk Management102 Questions
Exam 8: Cost Estimation and Budgeting105 Questions
Exam 9: Project Scheduling: Networks, Duration Estimation, and Critical Path105 Questions
Exam 10: Project Scheduling: Lagging, Crashing, and Activity Networks96 Questions
Exam 11: Advanced Topics in Planning and Scheduling: Agile and Critical Chain105 Questions
Exam 12: Resource Management98 Questions
Exam 13: Project Evaluation and Control107 Questions
Exam 14: Project Closeout and Termination101 Questions
Select questions type
The process of accelerating a project is referred to as:
Free
(Multiple Choice)
4.8/5  (37)
(37)
Correct Answer: Verified
D
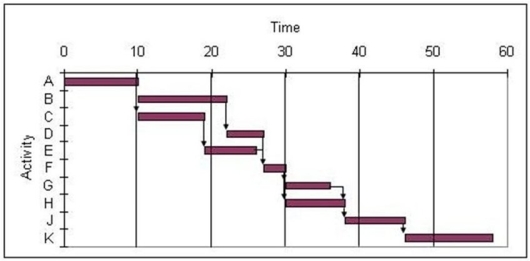 -Use the Gantt chart and the activity list to determine when resource 5 is free. Activity Resources Activity Resources 1 F 1 5 2 4 5 3 3 2 4
Free
(Multiple Choice)
4.8/5 (36)
Correct Answer:Verified
D
If an activity's cost is plotted against its duration on axes with zeros at the origin:
Free
(Multiple Choice)
4.9/5 (33)
Correct Answer:Verified
C
The most common type of logical sequencing between tasks is referred to as the:
(Multiple Choice)
4.8/5 (32)
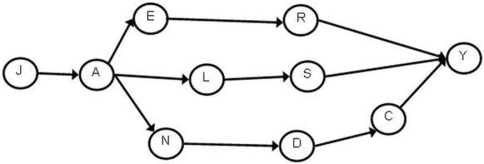
Sketch the network described in the table in AOA format.
Activity Predecersar -
(Essay)
4.7/5 (33)
Determine early start and early finish times for all activities in this network.Activity duration in days appears under each arrow.
(Essay)
4.8/5 (38)
The least common type of lag relationship occurs when a successor's finish is dependent upon a predecessor's start.
(True/False)
4.9/5 (43)
The most common method for shortening activity durations involves the decision to:
(Multiple Choice)
4.7/5 (30)
The AOA network described by this table needs: Activity Predecessor -- -- A, B ,
(Multiple Choice)
4.9/5 (33)
Quite often the marginal gains in employee productivity decrease dramatically with the increased use of overtime.
(True/False)
4.9/5 (34)
The BEST approach to network representation of a large and hugely complex project is to:
(Multiple Choice)
4.8/5 (41)
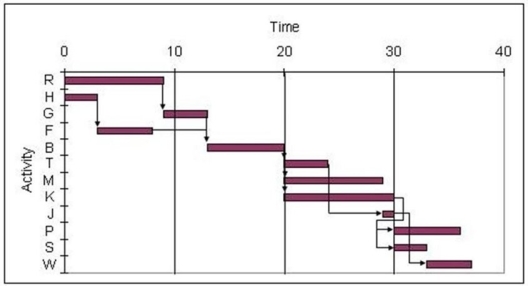 -Use the Gantt chart and activity list to determine which resource is used the least. Activity Resources Activity Resources 3,5 1,2 1 4 2,5 3 4,1 1 2 3,4 2 3
(Multiple Choice)
4.8/5 (35)
What is the minimum completion cost of this project if there is a penalty of $1,000 for each day the project lasts longer than 27 days? Activity durations in days and crash costs in dollars are given in the table.
Reg Crash Reg Crash Reg Crash Reg Crash Activity Length Length Cost Cost Activity Length Length Cost Cost 7 6 400 1,200 7 5 800 1,500 1 1 450 450 6 5 500 1,250 9 6 550 2,350 4 4 600 600 9 7 500 1,650 10 8 450 1,350 2 1 600 1,800 8 6 675 1,750
(Essay)
4.9/5 (29)
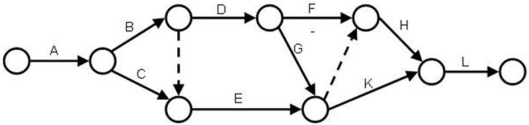
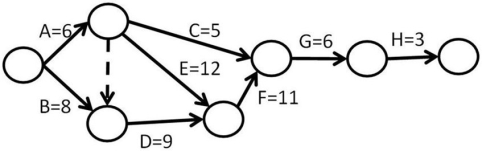 -What is the late finish for activity D in the network shown in the diagram?
(Multiple Choice)
4.9/5 (32)
A project has the activity duration and cost information indicated in the table where all times are in weeks.What is the lowest total cost for completing this project in 35 days? Activity Predecessor Normal Time Normal Cost Crash Time Crash Cost A -- 8 \ 12,000 5 \ 22,000 A 12 \ 18,000 9 \ 32,000 C A 15 \ 22,000 9 \ 62,000 3 \ 9,000 2 \ 18,000 C 9 \ 15,000 5 \ 35,000 7 \ 5,000 5 \ 8,000 8 \ 13,000 6 \ 23,000 12 \ 20,000 8 \ 32,000 6 \ 45,000 4 \ 56,000
(Multiple Choice)
4.8/5 (34)
Brook's Law states that the typical crashing decision to add more resources to an activity only delays the activity further.
(True/False)
4.7/5 (34)
-Use the Gantt chart and the activity list to determine which resource is needed earliest in this project. Activity Resources Activity Resources 1 F 2 3 3 4 4 2 5 2 1
(Multiple Choice)
4.8/5 (36)
Filters
- Essay(0)
- Multiple Choice(0)
- Short Answer(0)
- True False(0)
- Matching(0)